Written by Patrick Duran, Frank LaFontaine, and Erika Duran
Category 5 Hurricane Dorian passed over the Bahamas between September 1 and 3 2019, producing catastrophic destruction and causing at least 60 direct fatalities in the island nation. In addition to the impacts on human life, strong, slow-moving hurricanes like Dorian can leave lasting effects on the ocean over which they travel. Through a process known as upwelling, hurricanes bring colder water from below the surface up to the top layer of the ocean. As a result, a trail of cooler sea surface temperatures (SSTs), also referred to as a “cold wake,” is often visible behind a passing storm. Meteorologists and oceanographers can monitor changes in SST and identify a cold wake following tropical cyclones using satellite data.
NASA SPoRT produces composite maps of SST twice daily using data from the VIIRS-NPP, MODIS-Aqua, and MODIS-Terra instruments, along with OSTIA-UKMO data obtained from the GHRSST archive at NASA’s Jet Propulsion Laboratory and the NESDIS GOES-POES SST product. The input data are weighted by latency and resolution to produce the composite, which is available at 2 km resolution.
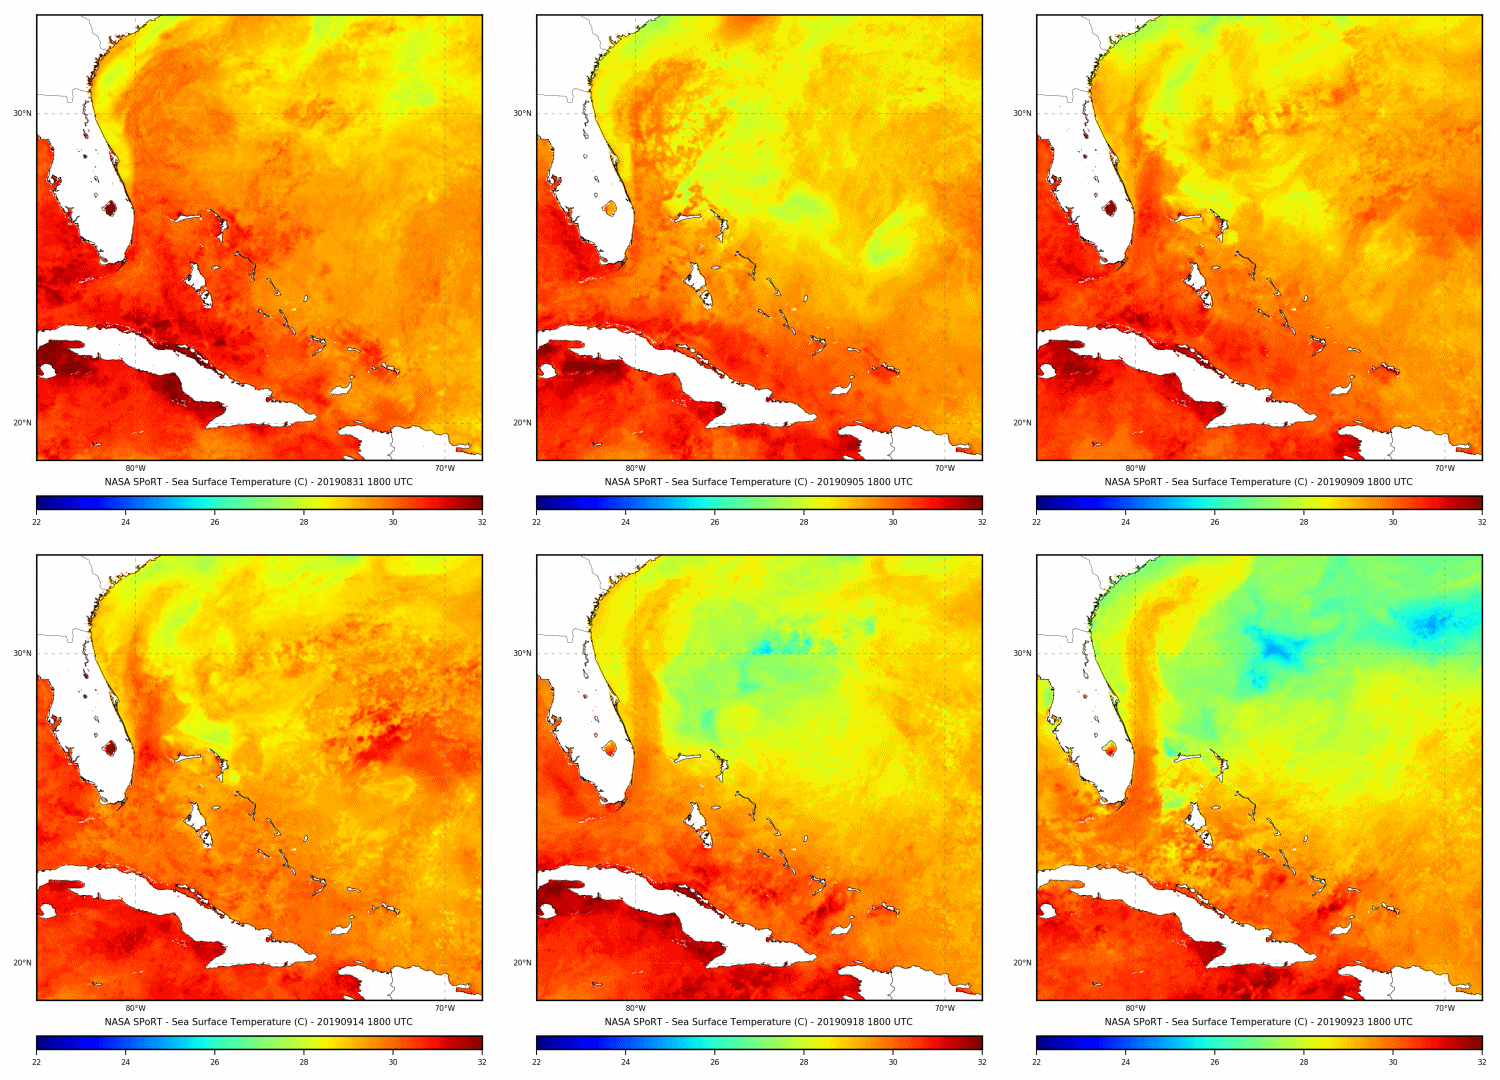
Figure 1 shows a loop of the SPoRT SST composite from August 31 – September 23, 2019 over a region that includes the Bahamas and the Southeast United States. Two rounds of SST cooling are observed as Hurricanes Dorian and Humberto move through the region.

On August 31, very warm SSTs of around 29-30 deg Celsius (84-86 deg Fahrenheit) overspread the waters surrounding the Bahamas (Fig. 2).

After Hurricane Dorian tracked through the region and made landfall in North Carolina on September 6, the waters north of the Bahamas were considerably cooler – in the 26–29 deg Celsius (79–84 deg Fahrenheit) range (Fig. 3).

Over the next week, the surface waters warmed a degree or two (Fig. 4), but did not fully recover to the same temperature observed on 31 August.

On September 13, Tropical Storm Humberto formed 210 km (130 miles) ESE of Great Abaco Island. As the storm tracked northeast past the Bahamas, it encountered the cold wake left by Hurricane Dorian the previous week. These cooler waters, combined with the influence of some dry air and vertical wind shear, inhibited the storm’s intensification as it passed by the Bahamas. On September 15, Humberto moved over the warmer waters of the Gulf Stream off the coast of North Florida (Fig. 5) intensified to hurricane strength.

Humberto continued to strengthen, and attained a maximum sustained wind speed of 125 MPH as it passed by Bermuda on September 19. Its strong winds and associated waves overturned the same region of ocean that was previously affected by Hurricane Dorian, decreasing sea surface temperatures to as low as 25 deg Celsius (77 deg Fahrenheit) in some areas (Fig. 6).

These images highlight the effect that tropical cyclones can have on SST, and how a hurricane can make it more difficult for any subsequent storms to intensify over the same region. Satellite analyses of SSTs (such as those produced by NASA SPoRT) allow forecasters to monitor SST across the globe, helping them to produce better forecasts of tropical cyclone intensity in all ocean basins.
