MODIS fog product highlights fires

The daytime MODIS pass over Southeast Texas/Louisiana highlighted an interesting feature.  The 1944z 1/26/2010 fog product pass clearly showed 3 “hot spots” that did not show up in the GOES visible product nor in the  MODIS visible.  An altocumulus deck was developing and expanding northeast throughout the day and across the two northern burn sites.

MODIS fog product 1944z

GOES Visible 1945z

Surface observations from KJAS-Jasper Airport to the west of these plumes.
METAR KJAS 271845Z AUTO 13007KT 10SM OVC095 17/06 A3026 RMK AO2 T01710061
METAR KJAS 271905Z AUTO 12004KT 10SM OVC095 18/06 A3025 RMK AO2 T01750064
METAR KJAS 271925Z AUTO 11005KT 10SM BKN095 18/07 A3024 RMK AO2 T01830068
METAR KJAS 271945Z AUTO 16007KT 120V180 10SM BKN095 19/07 A3023 RMK AO2 T01900070
METAR KJAS 272005Z AUTO 17008KT 10SM OVC085 19/08 A3022 RMK AO2 T01900075

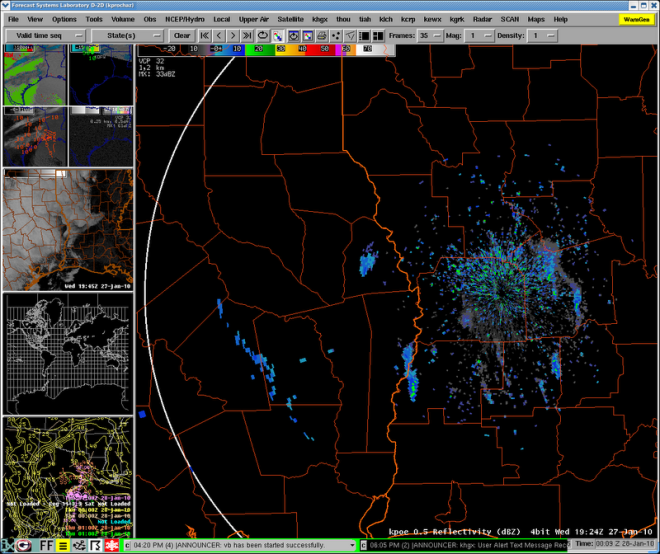
Radar sequence from Fort Polk KPOE 88-d

1915z

1924z

1934z

1944z

1954z

2004z

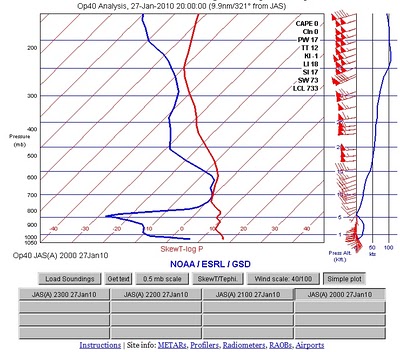
RUC Sounding at KJAS-Jasper Texas
The RUC sounding indicates the presence of the AC/mid level moisture transport from SW to NE and the mixing layer transport winds.

The plumes can be clearly seen on the radar imagery sequence and in the Modis fog product. Interestingly this is during the day, not a time that the fog product would typically be used. And that the plumes are visible beneath or through a mid level deck may have some uses. Perhaps the plume has extended above the mid level deck but this seems unlikely given the circular nature of the highlighted instead of being stretched downwind to the ENE as the cloud movement would support, and the radar plumes clearly show the low level trajectory northward albeit these images are only the 0.5 degree slices. The 0.5 degree beam height was approximately 4400 ft for the plume to the WNW of the KPOE radar and 1800 ft for plume to the east of the radar.

It would be interesting to find out if others have noted this in other areas or under different cloud regimes.

Kent Prochazka
Forecaster at Houston/Galveston

MODIS False Color Images and the April oil rig fire off Louisiana

Have included a 1km picture, False color, of the oil slick from the rig fire/sinking and subsequent oil slick. This better shot taken on Sunday, had some enhancement from favorable Sun angle to get a good reflection.  We passed it along to our EMs,  who are quite concerned with any of the slick hitting the beaches along the Alabama and western Florida panhandle due to tourist traffic to the beaches on the upswing.

Also of note is increased dirt and such from the rivers flowing into the bays..then the Gulf along the Al/MS/LA coastline.

Stephen Miller

Mobile AL

p.s. I see that the Sunday visible shot has made the national news…with CNN commenting on it this Tuesday morn.

EDIT: Have, with Kevin F’s assistance, redid and posted a color composite 1km shot of an oil slick from April 25, 2010, and a 500m Color Composite shot from April 26, 2010.

A 1km resolution Color Composite shot of an oil slick from a rig fire and sinking off the Louisiana coast.

A MODIS 500m Color Composite from April 26, 2010 of an oil slick from an oil rig fire and sinking.

Use of LMA data “tips the scales” toward a warning

In the late evening of April 24, a strong storm was approaching Marion County in southeast Tennessee. I evaluated the storm to be just below severe levels. In the 4-panel image below, the LMA source density is in the lower left panel. 5 minute lightning and Hail Index are also in that panel. The POSH on this storm at this time was 40%, and source density values were around 80.

A 4-panel display of radar data from KHTX that incorporates LMA source density

At this point, I was on the fence about issuing a warning for Marion County, but leaning against it. Then the next LMA image came in:

LMA source density in the lower left panel showed a big jump from the previous image

Source density values jumped up over 200. Other radar products did not indicate significant intensification – other than the POSH rising to 60%, just about everything else stayed the same. But based on the big jump in source density values and the slight jump in POSH (and the favorable storm environment), I decided to issue a SVR.

The storm produced damaging winds near Jasper around 0410Z (1110 am CDT). The jump in LMA source density values gave about a 20 minute lead time.

As shown in this example, the LMA source density product can be useful along side other radar products and help “tip the scales” on a storm that may be borderline severe.

Doug Schneider

WFO MRX

GOES Low Cloud and Fog Depth Analysis in Complex Topography

Several widespread moderate to heavy snowfall events across New Mexico during late January 2010 lead to several periods of low clouds and fog.  This particular case shows the high resolution detail provided by the low cloud base and combined fog products within the 60 mile extent of complex terrain between Albuquerque and Santa Fe.

Left image is GOES 4km Low Cloud Base and right image is Combined Fog Product 01/30/10 valid 0615Z

Notice the green shading over Albuquerque, indicating that low cloud base detection is greater than 1000 feet.  The red shading over Santa Fe indicates that low cloud base detection is less than 1000 feet.   The observations at both sites support the GOES low cloud base product:

KABQ 300256Z 20004KT 10SM FEW030 SCT045 SCT150 00/M04 A3011
KABQ 300356Z 00000KT 10SM FEW030 BKN042 M01/M03 A3011
KABQ 300456Z 00000KT 10SM FEW030 OVC042 M01/M04 A3011
KABQ 300556Z 00000KT 10SM FEW028 OVC040 00/M03 A3011

KSAF 300253Z 00000KT 10SM OVC009 M01/M03 A3008
KSAF 300435Z AUTO 33003KT 9SM OVC003 M02/M03 A3008
KSAF 300518Z AUTO 32005KT 3/4SM BR OVC001 M02/M03 A3009
KSAF 300618Z AUTO 34005KT 1/4SM FZFG VV001 M03/M04 A3009

The Combined Fog Product on the right indicates that along with the low clouds we should see areas of fog. In fact, the KSAF observation is carrying one quarter mile visibility.   The area around KABQ in the combined fog product indicates a large area of fog depth near 400m. However, no fog was observed at the site all night.  It should be noted that the combination of low clouds detected less than 1000 feet and the presence of depth values in the combined fog product has shown a much better correlation than for low cloud bases detected greater than 1000 feet. This has been noted by several forecasters.

Left image is GOES 4km Low Cloud Base and right image is Combined Fog Product 01/30/10 valid 1015Z

Low clouds and fog continued to develop across the region through the predawn hours.  The observations at both sites support the strong contrast in low cloud ceiling height between Albuquerque and Santa Fe.

KABQ 300756Z 00000KT 10SM SCT030 OVC040 01/M03 A3012
KABQ 300856Z 00000KT 10SM SCT028 OVC037 01/M03 A3012
KABQ 300956Z 00000KT 10SM FEW025 OVC037 01/M03 A3011

KSAF 300833Z AUTO 33006KT 1/2SM FZFG VV001 M04/M05 A3009
KSAF 300950Z AUTO 00000KT 1 1/4SM BR OVC001 M04/M04 A3008
KSAF 301035Z AUTO 35003KT 1/2SM FZFG OVC001 M04/M05 A3008

SPoRT Data Available in WRF EMS version 3.1

Two SPoRT datasets are available to initialize model runs in version 3.1 of the Weather Research and Forecasting Environmental Modeling System (WRF EMS):

(1) SPoRT’s enhanced Sea Surface Temperature (SST) composites, and
(2) a 3-km version of the NASA Land Information System (LIS) over the Southeastern U.S.

The enhanced SST product for model initialization features the full 1-km resolution SST grid in GRIB-2 format with reduced latency over the MODIS-only SSTs due to the inclusion of microwave SST data from AMSR-E.  The enhanced SSTs also contain a special analysis over the Great Lakes, which includes a built-in ice-masking by setting SSTs to 270K at ice points.  The product covers much of North and Central America on a 9000 x 6000 domain (Figure 1).  As with the MODIS-only SSTs, the composites are generated 4 times per day at 0400, 0700, 1600, and 1900 UTC.   To use the SPoRT SSTs in the WRF EMS v3.1, simply select “SFC = sportsst” in the ems_autorun.conf file.  SPoRT also recommends setting “BESTHR = sstsport” to use the SST composite that most closely matches in time the model initialization hour.  For a backup capability, one could also set “SFC = sportsst,ssthr” to give highest priority to the sportsst, but also use ssthr as a backup in case the sportsst data are not available.

The LIS land surface model (LSM) option is advantageous to initialize land surface fields at a representative high-resolution for local model runs.  Instead of interpolating coarser resolution, less representative soil moisture/temperature/etc. from a large-scale model, the LIS output provides 3-km resolution land surface fields from the Noah LSM to initialize the WRF EMS over Southeastern U.S. domains (sample soil moisture field shown on the current LIS domain in Figure 2).  The use of high-resolution LIS initialization data has been shown to improve the WRF predictions of 2-m temperatures and sea breezes (Case et al. 2008; Weather and Forecasting) and explicit summer convective precipitation over the Southeastern U.S. (Case et al. 2009, 2010).  To use the LIS fields for initializing the WRF EMS v3.1, simply set “LSM = lis” in the ems_autorun.conf file.  Similarly, a backup LSM dataset could be used in the event that the LIS data are missing (e.g. “LSM = lis,namptile” in ems_autorun.conf).  SPoRT plans to expand the current 3-km LIS domain in the near future to cover a larger portion of the Continental U.S.

Happy modeling!

Figure 1. SPoRT enhanced SST domain coverage.

Figure 2. Sample LIS soil moisture field showing SE U.S. 3-km domain.

MODIS 1km False Color and Public Zone Boundaries

In July 2009 WFO ABQ unveiled an extensive revision of our public zone forecast boundaries.  Since the climatological variation of precipitation and temperature patterns across the state are highly terrain driven, we chose to encapsulate a high level a topographical detail in creating these new zone boundaries.  The 1km MODIS False Color imagery after a lengthy period of significant winter weather during January 2010 provided great assurance of the operational improvement.

The Northwest Plateau is nearly snow free while the surrounding higher terrain has extensive snow cover.

Northwest Plateau NMZ501

The West Central Highlands contain a sharp snow free region around Grants and east of Acoma Pueblo.

West Central Highlands NMZ507

A very nice example is shown for the San Francisco River Valley which is nearly 6000 feet lower than the surrounding terrain to the north and east.

San Francisco River Valley NMZ509

The Lower Chama River Valley also has a nice snow free region around Espanola surrounded by widespread snow cover.

Lower Chama River Valley NMZ517

And finally, the Lower Rio Grande Valley around Socorro and the Upper Tularosa Valley around Carrizozo.  Notice the dark blueish/black color west of Carrizozo is the Malpais lava bed.

Lower Rio Grande and Upper Tularosa Valleys NMZ520/NMZ525

Situational Awareness with Total Lightning

Springtime is on its way and with it is the potential for thunderstorms across the Southeast.  This morning, we are watching a large number of storms move across the Birmingham, Alabama county warning area as shown in the radar image below (Figure 1).  The North Alabama Lightning Mapping Array (NALMA) can provide situational awareness for more than just severe weather applications.  Right now, the NALMA can help show what storms are electrically active and therefore represent a threat for cloud-to-ground lightning.  The strong radar signature just east of Tuscaloosa and on the west-central Alabama border make it no surprise that lightning is active in these storms, as seen by NALMA (Figure 2).  However, there are numerous additional cells across the region where the potential for lightning exists.  With the NALMA data we can, at a glance see which cells are becoming electrically active (circles-Figure 2).

Figure 1: Birmingham radar reflectivity from 1520 UTC on 10 March 2010.

Figure 2: Corresponding total lightning observations from NALMA at 1522 UTC. The circled regions indicate where storms shown on the radar image are becoming electrically active.

AIRS Thermodynamic Profile Assimilation Leads To Improved Precipitation Forecasts

NASA’s Atmospheric Infrared Sounder (AIRS) has the capability of producing near-radiosonde quality vertical soundings with a vertical resolution much greater than previous sounders. SPoRT has successfully assimilated temperature and moisture soundings retrieved from AIRS into the WRF 3DVAR analysis system (WRF-Var) and assessed using 37 case study days from winter 2007. The assimilated data produce a 3-dimensional analysis that is then used to initialize a WRF forecast on a regional, 12-km domain.

One particular case in which AIRS has excelled is a February 13, 2007 extreme rainfall case in Eastern Texas prompted by a cold front pushing eastward across the Great Plains. On February 12, clear skies over Eastern Texas and the Western Gulf of Mexico allowed for the observation and assimilation of many high-quality AIRS profiles at around 0900Z. The figure below shows the location of the AIRS profiles. The colored pixels indicate the pressure above which the highest quality AIRS profiles are assimilated (e.g. black pixels denote profiles that have quality data all the way to the surface). Note that there is a large swath of AIRS profile data located over the Western Gulf of Mexico.

The WRF model was initialized at 0000 UTC on February 12, data were assimilated at 0900 UTC, and these AIRS-enhanced initial conditions were used to finish the forecast out to 24 hours. The image below depicts three model metrics from the 24-hour forecast (valid at 0000 UTC on February 13): 6-hour cumulative precipitation (top row), 1000 hPa dew point temperature (middle row), and convective available potential energy (CAPE). The far right column is the verifying “ground truth” analysis. For 6-hour cumulative precipitation, the truth field is gridded Stage IV precipitation fields, which combine radar and rain gauge data. For the dew point and CAPE fields, the North American Mesoscale (NAM) model analysis valid at 0000 UTC on 2/13 is used. The left column represents the Control (no AIRS) forecast; the middle column the AIRS-enhanced forecast.

With the inclusion of AIRS temperature and moisture profiles (upper middle), the intensity and location of the 6-hour cumulative precipitation maximum in the line of storms crossing Eastern Texas is represented much better than in the Control (upper left) compared to the Stage IV precipitation data (upper right). This convective precipitation is improved with the inclusion of AIRS due to improved forecasts of CAPE and lower-level moisture, which lead to greater instability in the model in that region. These improvements are validated in the comparisons to the NAM analysis. The advance of the 18-20 degree Celsius lower level dew points off the coast of Texas is depicted better in the AIRS-enhanced model run (middle) compared to the Control (middle left). Similarly, the AIRS-enhanced CAPE (lower middle) shows some of the 1800 J/kg CAPE values approaching the Texas coast that appear in the NAM analysis of CAPE (lower right). The Control run (lower left) has no CAPE values in that region above 1400 J/kg.

Follow on to “MODIS Maps Weekend Snow Cover in the Tennessee Valley”

This post is a follow-on to both GaryJ’s comments on this morning’s LIS snow water equivalent (SWE) post, and to the post on MODIS snow cover mapping.  I went ahead and produced a LIS SWE graphic at 1900 UTC 31 JAN 2010, approximately coincident to the time of the MODIS false color snow map (1919 UTC) and geographical area.

The image below shows the output from the 3-km SPoRT LIS that could be used to help quantify the actual water content of the snow cover.  Compared to the MODIS false color image in the previous post, it appears that the LIS-Noah SWE coverage may be slightly overdone on the southern edge of the swath from Arkansas to Georgia.  This is probably due to the fact that the Noah land surface model running within LIS adds to the SWE field anytime the land surface temperature is below freezing.  Therefore, areas of mixed precipitation or freezing rain also lead to an accumulation of the SWE field.

A unique product that may be worth considering is to supplement the MODIS snow mask with quantitative information from LIS within the mask indicated by MODIS.  Another option may be to assimilate AMSR-E SWE information to help adjust the LIS SWE field towards the satellite observations.

The LIS-Noah snow water equivalent in inches, valid at 1900 UTC 31 JAN 2010

MODIS Maps Weekend Snow Cover in the Tennessee Valley

From the traditional GOES satellite imagery used to monitor atmospheric and surface characteristics over a given region, clouds are difficult to distinguish from snow on the ground because of the similarity in the  albedo of these features at visible wavelengths.  However, the multispectral channels on the MODIS scanner, aboard the NASA Terra and Aqua satellites, have the ability to differentiate  between clouds and snow on the ground because these channels are sensitive to the albedo difference between snow and clouds at near-infrared wavelengths.  The figure below demonstrates this capability for the recent snow storm in the Tennessee River Valley.  In the image, clouds remain white, while snow on the ground is designated  by various shades of red.

MODIS false color snow image from January 31, 2010 at 1919UTC differentiating clouds from snow on the ground.