Transition of Research to Operations – Gridded NUCAPS

Transition of Research to Operations – Gridded NUCAPS

By Emily Berndt

SPoRT has been part of a collaborative effort within the Joint Polar Satellite System (JPSS) Proving Ground Sounding Initiative* to develop the capability for 2D display of satellite soundings in the NOAA NWS decision support system (AWIPS).  CrIS/ATMS (Cross-track Infrared Sounder/Advanced Technology Microwave Sounder) temperature and moisture soundings are processed through the NOAA Unique Combined Atmospheric Processing System (NUCAPS) and are good quality in clear to partly cloudy regions but soundings are poor quality where cloud cover is over 85% and when precipitating conditions exist.  Currently, NWS offices receive NOAA-20 CrIS/ATMS NUCAPS Soundings through the Satellite Broadcast Network for display as vertical soundings and Gridded NUCAPS is the capability to process and view these data horizontally and vertically (Fig. 1).  Up until now, Gridded NUCAPS has been pre-processed at SPoRT and provided experimentally to Alaska Region NWS offices and the Hazardous Weather Testbed.  The team worked with NOAA/CIRA/MDL to create an AWIPS plug-in to grid the soundings upon arrival and ingest in AWIPS.  Gridded NUCAPS has been a successful multi-organizational collaborative R2O/O2R project with a transition to operations in sight. With the official 19.2.1 AWIPS release coming soon SPoRT is finalizing development of training material and an NWS VLab page to highlight the Gridded NUCAPS capability, products, and helpful hints….more information will be forthcoming  as these items are completed!  NWS offices that are beta testers for new AWIPS releases, such as the Huntsville forecast office will be able to display Gridded NUCAPS with AWIPS 19.2.1-29 prior to the official release.

*including NOAA NWS, Science and Technology Corporation, the Cooperative Institute for Research of the Atmosphere, Geographic Information Network of Alaska, Space Science Engineering Center/Cooperative Institute for Meteorological Satellite Studies, and NOAA/NWS/MDL.
Blog-sounding-grid

Figure 1. Left: NOAA-20 CrIS/ATMS NUCAPS Sounding Availability in AWIPS and Right: Gridded NUCAPS plan view display of 700 mb Lapse Rates. Demontrates the NUCAPS Soundings are Gridded for plan view and cross section display.  Image courtesy of Kevin Fuell (UAH/NASA SPoRT).

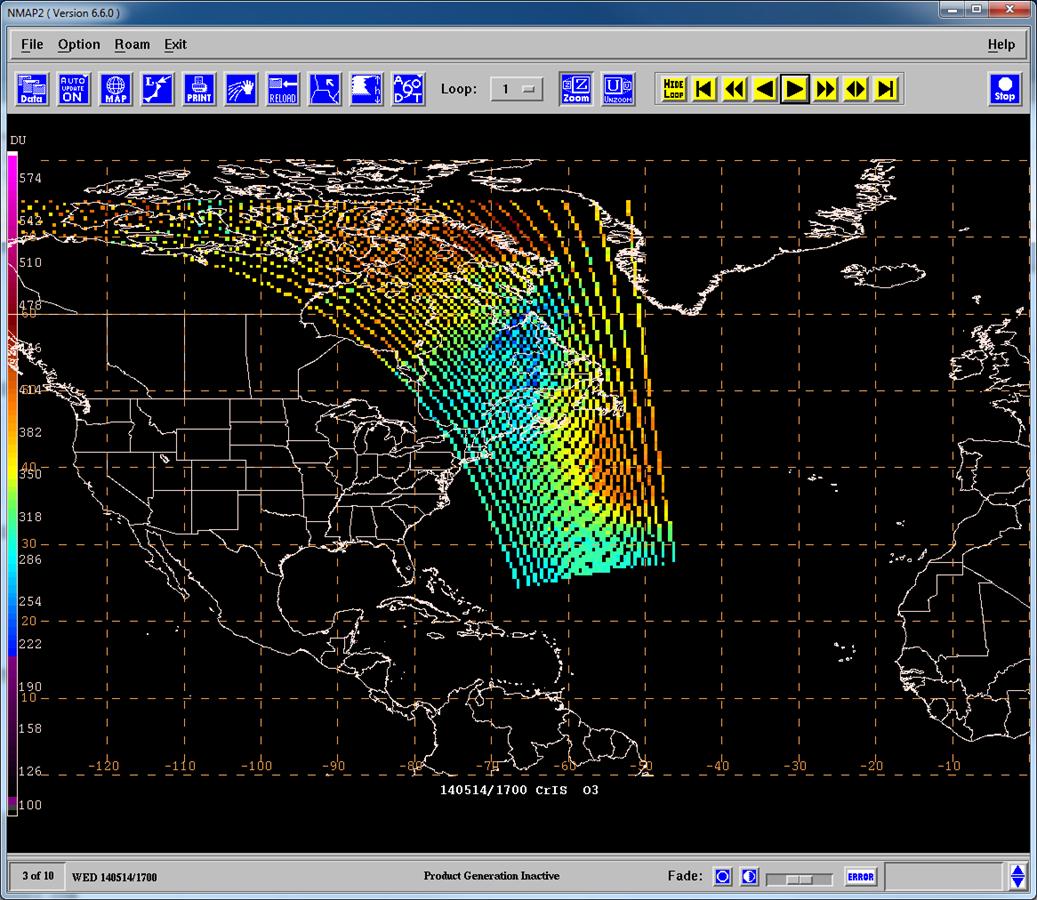
Gridded NUCAPS was originally developed to diagnose Cold Air Aloft (CAA; Weaver et al. 2019) and NWS Anchorage Center Weather Service Unit aviation forecasters have benefited from this capability to issue public products regarding CAA. Additionally Gridded NUCAPS has been extensively evaluated at the Hazardous Weather Testbed for assessing the pre-convective environment (Berndt et al. 2017). As part of the JPSS Sounding Initiative, the team of collaborators is exploring new applications for Gridded NUCAPS (e.g., fire weather, turbulence, and icing) and exploring the benefits of the microwave-only NUCAPS Soundings for applications in cloudy regions.  A few new capabilities of Gridded NUCAPS include display of fields such as precipitable water to diagnose moist/dry layers in the atmosphere, the Haines Index for fire weather potential (Fig.2), and SPoRT-developed ozone products (e.g., Total Ozone, Ozone Anomaly, and Tropopause Level) to diagnose the potential for tropopause folding and cyclogenesis.

Look for Gridded NUCAPS posters and presentations at the National Weather Association Annual Meeting and the AMS Joint Satellite Conference – both in September!

Picture2

Figure 2. Top: Example of Haines Index image and icons plotted with Gridded NUCAPS compared to Bottom: GFS Haines Index and Icons for a fire that began on 23 July 2018 near Northway, AK.


GOES-16 Air Mass RGB and NUCAPS Soundings

SPoRT has worked closely with the GOES-R and JPSS Proving Grounds to explore innovative applications for the Air Mass RGB and CrIS/ATMS NUCAPS Soundings.  Specific applications include identification of stratospheric air influence and tropopause folding to anticipate rapid cyclogenesis and hurricane tropical to extratropical transition.

When the Air Mass RGB was first introduced to NOAA NWS National Center forecasters in 2012, SPoRT developed a total column ozone product from the NASA AIRS instrument (a hyperspectral infrared sounder) as a way to help forecasters gain confidence in interpreting the qualitative RGB.  Since that time SPoRT has continued to develop quantitative ozone products such as the ozone anomaly and tropopause height products from additional hyperspectral infrared sensors such as CrIS/ATMS and IASI.

More recently, CrIS/ATMS NUCAPS Soundings were added to AWIPS-II for forecasters to utilize in operations.  SPoRT has specifically explored the utility of NUCAPS Soundings for hurricane tropical to extratropical transition (see link to training material).   With the availability of the GOES-16 Air Mass RGB and NUCAPS Soundings in AWIPS-II there is an opportunity to explore rapid cyclogenesis cases and extratropical transition events with next-generation satellite capabilities.  Since we have the capability to display the client-side generated Air Mass RGB here at SPoRT, here is a quick preview of how the NUCAPS Soundings can be used to compliment the Air Mass RGB.

nu_airmass_1817_labeled

GOES-16 AWIPS-II client-side generated Air Mass RGB 3 March 1817 UTC

Please note, the GOES-16 data posted on this page are preliminary, non-operational data and are undergoing testing. Users bear all responsibility for inspecting the data prior to use and for the manner in which the data are utilized.

The Air Mass RGB is able to detect temperature and moisture characteristics in the mid- to upper levels of the atmosphere.  Warm, dry air upper level air appears in red/orange tones. Dry upper level air appears more red when associated with anomalous potential vorticity as warm, dry, ozone-rich air is pulled downward by the jet stream circulation.   Dry upper levels away from the jet stream appear orange. In contrast warm, moist tropical air appears in green tones, appearing more olive when less moisture is present.

airmass_legend

Air Mass RGB interpretation guide adapted from EUMETSAT (Zavodsky et al. 2013)

In the Air Mass RGB image above you can see a well-defined upper-level temperature and moisture boundary across the southern U.S. associated with yesterday’ s passing frontal system.  NUCAPS Soundings can provide additional information about the thermodynamic and stability characteristics of the lower-levels of the atmosphere which cannot be deciphered in the Air Mass RGB.  The Sounding at Location 1 shows a mostly dry atmospheric column, which is typical for the orange colored regions (i.e dry upper levels) in the RGB, note however there are moister conditions around 850 mb.    The Soundings at Location 2 and 3 in the green colored regions (i.e. moist upper levels)  confirm moist upper-level conditions.  What the NUCAPS Soundings reveal is a layer of much drier mid-level air between about 850-400 mb, which cannot be detected in the Air Mass RGB.  The ability to detect such a layer can be important in data sparse regions.  Although this is a benign weather situation where much of the Southeast enjoyed sunny, cool, and dry conditions today, this same technique can be applied to more intense, high impact events to assess the thermodynamic environment surrounding a developing low pressure system or weakening hurricane where moist or dry layers can have an impact on storm intensity.

nuprofile1

AWIPS-II CrIS/ATMS NUCAPS Sounding 3 March 2017 1817 UTC at Location 1

nuprofile2

AWIPS-II CrIS/ATMS NUCAPS Sounding 3 March 1817 UTC at Location 2

nuprofile3

AWIPS-II CrIS/ATMS NUCAPS Sounding 3 March 2017 1817 UTC at Location 3


For more information regarding the Air Mass RGB, including applications and interpretation guides for the color features in the imagery:

SPoRT expands Ozone Products to include Next-Generation JPSS Ozone Retrievals

Author: Emily Berndt

This week NASA SPoRT began producing and disseminating real-time Cross-track Infrared and Microwave Sounding Suite (CrIMSS) ozone products to the Ocean Prediction Center, Weather Prediction Center, and Satellite Analysis Branch. CrIMSS retrievals are a combination of retrievals from the Cross-track Infrared Sounder (CrIS) and Advanced Technology Microwave Sounder (ATMS) instruments aboard the NOAA/NASA Suomi NPP satellite which is our Nation’s next generation polar-orbiting operational environmental satellite system. Since CrIS is an infrared sounder its ability to detect atmospheric variables through cloudy regions is limited, therefore the retrievals are combined with ATMS retrievals to view atmospheric variables in partly cloudy regions. Despite the use of microwave retrievals, retrievals are still degraded or blocked by thick clouds, similar to AIRS. Recall AIRS infrared retrievals are also combined with microwave retrievals from the Advanced Microwave Sounding Unit (AMSU) to overcome this limitation of the infrared sounder.

Expanding the ozone products to included CrIMSS retrievals will provide National Center forecasters with additional retrievals to evaluate for identifying stratospheric air related to forecasting rapid cyclogenesis and high-wind events.

While the CrIMSS algortihm differs from AIRS, the creation of ozone products using CrIMSS is the first step to expanding SPoRT’s ozone products to the next generation instrumentation aboard the Suomi NPP satellite. There are slight variations in the retrievals, but decent agreement in ozone concentration is observed between AIRS and CrIMSS retrievals. Retrievals processed via The NOAA Unique CrIS/ATMS processing System (NUCAPS) are planned for release this summer. NUCAPS is a version of the AIRS Science Team Algorithm. Once SPoRT has access to the NUCAPS retrievals the CrIS ozone product will be updated. The advantage of the NUCAPS retrievals will be the the ability to directly compare the AIRS and CrIS/ATMS ozone retrievals across satellite platforms/instruments and provide forecasters with greater spatial and temporal coverage.

The four images below are an example of consecutive AIRS and CrIMSS ozone retrievals now available to forecasters in N-AWIPS format.

1400 UTC 14 May 2014 AIRS Total Column Ozone

1400 UTC 14 May 2014 AIRS Total Column Ozone

1500 UTC 14 May 2014 CrIMSS Total Column Ozone

1500 UTC 14 May 2014 CrIMSS Total Column Ozone

1600 UTC 14 May 2014 AIRS Total Column Ozone

1600 UTC 14 May 2014 AIRS Total Column Ozone

1700 UTC 14 May 2014 CrIMSS Total Column Ozone

1700 UTC 14 May 2014 CrIMSS Total Column Ozone

Is that a hurricane off of California?

Well, it’s February and it’s the East Pacific off of California, so the short answer is no.  But. . .what an amazing structure, right?  We haven’t seen anything this good looking in the tropical Atlantic in years!  But I digress. . .

MODIS RGB Air Mass product valid at 0621 UTC on 02/28/14.  The blue lines are the boundaries of OPC (north), TAFB (south), and Hawaii (west)

MODIS RGB Air Mass product valid at 0621 UTC on 02/28/14. The blue lines are the boundaries of OPC (north), TAFB (south), and Hawaii (west)

MODIS RGB Air Mass product valid at 1032 UTC on 02/28/14.

MODIS RGB Air Mass product valid at 1032 UTC on 02/28/14.

The first image was collected four hours before the second image and you can see how the center of the intense storm developed an “eye-like” feature (images courtesy of NASA SPoRT).  Notice the distribution of the pinks and reds in both images as well.  That is dry, stratospheric air filling the center of the strong upper-level low (~300-500 mb).  The second area shows an additional area of pink approaching the southern California coast.  This area is associated with strong instability that has led to rare California thunderstorms.

So, how do we know if there is stratospheric air?

AIRS Total Column Ozone product valid at 2200 UTC on 02/27/14.

AIRS Total Column Ozone product valid at 2200 UTC on 02/27/14.

AIRS Ozone Anomaly Product valid at 2200 UTC on 02/27/14.

AIRS Ozone Anomaly Product valid at 2200 UTC on 02/27/14.

The first image above is the AIRS Total Column Ozone product developed at NASA SPoRT.  The color bar on the left is not correct.  The main idea is that the warmer (cooler) the colors, the more (less) ozone is in the atmospheric column.  The green colors indicate ozone levels above 200 Dobson Units (ozone unit of measurement) with the magenta areas indicating ~500 Dobson Units.  The second image shows the AIRS Ozone Anomaly product with the first level of blue indicating 125% of normal, while the yellow region indicates >200% of normal ozone at that latitude and geographic location.  Stratospheric air is associated with high levels of ozone and potential vorticity which can help identify the strength of the upper-level low.  These images show the connection of this ozone pocket with the “reservoir” of ozone located in the northern latitudes at this time of year.

AIRS Total Column Ozone Product valid at 1000 UTC on 02/28/14.

AIRS Total Column Ozone Product valid at 1000 UTC on 02/28/14.

AIRS Ozone Anomaly valid at 1000 UTC on 02/28/14.

AIRS Ozone Anomaly valid at 1000 UTC on 02/28/14.

As the upper-low cut off and became stacked over the surface low (~971 mb), you can see how the high concentration of ozone becomes more focused over the storm.  Once again, the magenta coloring indicates ozone levels >500 Dobson Units.  The anomalies are more incredible with a large area of >200% of normal directly west of southern California.

I will continue to work with forecasters at OPC, TAFB, SAB, and WPC on discovering ways to use these products in conjunction with the RGB Air Mass products to gauge storm strength and look for signals upstream of developing tropopause folds and stratospheric intrusions.

GOES-15 Visible imagery with the GLD-360 30-minute lightning density product overlaid.

GOES-15 Visible imagery with the GLD-360 30-minute lightning density product overlaid.

The ozone isn’t the only impressive part of this storm.  Notice the occasional bursts of lightning within the spiral bands of the parent storm.  Although not completely unusual, this is a great indicator of how much energy is available to this storm.

GOES-Sounder RGB Air Mass product with GLD-360 lightning strikes overlaid.

GOES-Sounder RGB Air Mass product with GLD-360 lightning strikes overlaid.

I put together a longer animation of the GOES-Sounder RGB Air Mass product with the GLD-360 lightning strikes overlaid.  Note the first system that came ashore in California earlier this week, then moved over the four-corners regions with plenty of lightning, especially for this time of year.  The current storm is seen lurking offshore with more lightning developing in a band of thunderstorms that moved from Los Angeles to just north of San Diego.  This system will be responsible for the next bought of winter weather for the Midwest to the Mid-Atlantic next week.

Thanks for reading and as always, feel free to contact me with questions and feedback!

Strong North Atlantic Storm

I had this posted on the OPC Facebook page yesterday afternoon and thought it would make an interesting, short blog post:

There is a strong, hurricane-force storm affecting Ireland and Great Britain today. As part of our GOES-R and JPSS Proving Ground activities, some new experimental products are being introduced to forecasters.

This image shows the SEVIRI (Met-10) RGB Air Mass product overlaid with a new AIRS Ozone product and ASCAT winds. The green numbers represent concentration of ozone, which correlates well with downward momentum of stratospheric air (high in ozone and potential vorticity). This storm has greater than 400 Dobson units (black circle), which means lots of descending air near the comma-head.

This ASCAT image was chosen as it shows storm-force winds in two locations (> 42 kts), but some stronger (> 56 kts) near the comma head co-located with the high ozone readings. This storm is officially designated a hurricane-force storm based on a later ASCAT-B pass (not shown) which showed winds greater than 64 kts. This is one way forecasters can combine data sets to fully assess the situation and even provide more confidence in a forecast.

For more information on this storm and the official high seas forecast, please visit OPC’s webpage at: www.opc.ncep.noaa.gov

SEVIRI RGB Air Mass product overlaid with the AIRS Total Column Ozone and ASCAT winds valid at 1400 UTC on 12/18/13. The black circle highlights the descending stratospheric intrusion near the comma-head/bent back front.

SEVIRI RGB Air Mass product overlaid with the AIRS Total Column Ozone and ASCAT winds valid at 1400 UTC on 12/18/13. The black circle highlights the descending stratospheric intrusion near the comma-head/bent back front.

New AIRS Ozone Anomaly Product

Author: Emily Berndt

Here at SPoRT we’ve been comparing the RGB Air Mass Imagery with the AIRS Total Column Ozone product to confirm regions of stratospheric air on the RGB Air Mass Imagery. The presence of stratospheric air can identify regions susceptible to tropopause folding. Identifying these regions can aid in forecasting cyclogenesis and non-convective winds as well as the promotion or suppression of convection.  Recall that stratospheric air shows up as red/orange on the RGB Air Mass Imagery. The MODIS image from 1027 UTC this morning highlights the low pressure system off the Pacific Coast. Notice the red coloring collocated with the system (purple circle). We shouldn’t jump right to the conclusion that stratospheric air is present because limb cooling can cause a false influence of red and blue coloring on the edge of the swath.

20130626_1027_sport_modis_conusa_airmass

MODIS RGB Air Mass Image 26 June 2013 1027 UTC

When we look at the AIRS Total Column Ozone product from 1000 UTC, there are high ozone values in this same region (purple circle). So yes we see red coloring on the RGB Air Mass Image and high values of ozone present, but how do we know whether these high ozone values are ozone-rich stratospheric air or are normal values for that region and time of year? 

20130626_1000_sport_natloc_airso3

AIRS Total Column Ozone 26 June 2013 1100 UTC

Thus far we haven’t found a magic number or threshold of ozone concentration that represents stratospheric air more clearly. So our new Ozone Anomaly product can answer the question of whether there is a significant enough deviation from climatology to consider high ozone regions as stratospheric air.

Two literature references have provided the information to create an Ozone Anomaly product.  Van Haver et al. (1996) states stratospheric air is characteristic of ozone values that are 25% greater than climatology. Ziemke et al. (2011) constructed a global stratospheric ozone climatology using the Ozone Mapping Instrument and Microwave Limb Sounder integrated ozone profiles. The Ozone Anomaly product is derived by calculating the percent of normal (climatology) on a scale from 0-200 percent. Interpretation of percent of normal is very easy: values at 100% equal climatology, less than 100% are below climatology, and above 100% are greater than climatology. We’ve constructed the color table so that values 125% and great are blue. One can quickly look at the image and see regions that meet the criteria for stratospheric air. Now compare all three products, we see red on the RGB Air Mass Image, high ozone values on the Total Column Ozone product, and the Ozone Anomaly product establishes the high ozone values do indeed represent stratospheric air.

20130626_1000_sport_natloc_airso3anom

AIRS Ozone Anomaly 26 June 2013 1100 UTC


Van Haver, P. and Coauthors, 1996: Climatology of tropopause folds at midlatitudes. Geophys. Res. Lett., 23, 1033-1036.

Ziemke J. R., S. Chandra, G. J. Labow, P. K. Bhartia, L. Froidevaux, J. C. Witte, 2011: A global climatology of tropospheric and stratospheric ozone derived from Aura OMI and MLS measurements. Atmospheric Chemistry and Physics, 11, 9237-9251.


Initial Qualitative Evaluation of Retrieved CrIMSS Profiles

Level 2 retrieved temperature and moisture profiles in clear and partly cloudy conditions can be obtained from the new Cross-track Infrared Microwave Sounding Suite (CrIMSS), which uses infrared measurements from the Cross-track Infrared Sounder (CrIS) and microwave measurements from the Advanced Technology Microwave Sounder (ATMS).  These observations are available from the Suomi-NPP as operational legacy observations to those coming on the JPSS.

SPoRT has begun processing the 42-level temperature and 22-level moisture CrIMSS Environmental Data Record (EDR) data and qualitatively comparing these soundings to other hyperspectral sounders (AIRS and IASI), in situ observations (RAOBs), and regional models (North American Mesoscale (NAM) and Rapid Refresh (RAP)).  All of these comparisons are available on SPoRT’s hyperspectral sounding comparison page (http://weather.msfc.nasa.gov/sport/hyperspectral_comparisons/).

As an example of these comparisons, the three images below were taken from that webpage for soundings at Vandenberg Air Force Base (VBG) in California all valid around 2100 UTC on 31 March 2013.  Note that the CrIMSS and AIRS soundings both match very closely to the RAP temperature sounding with near-perfect agreement of tropopause height in the AIRS sounding and similar tropopause placement in the CrIMSS sounding.  Both the AIRS and CrIMSS soundings highlight a low-level moist conditions and mid-level dry conditions.  Satellite soundings in this form can be used by forecasters to gain additional confidence in their model guidance or obtain additional information in regions where there are not other upper air observations (such as over Northern Mexico and the Gulf of Mexico).

Temperature and dew point soundings at VBG at 2100 UTC on 31 March 2013.

Temperature and dew point soundings at VBG at 2100 UTC on 31 March 2013.

Temperature and dew point soundings from CrIMSS at VBG at 2100 UTC on 31 March 2013.

Temperature and dew point soundings from CrIMSS at VBG at 2100 UTC on 31 March 2013.

Temperature and dew point soundings from AIRS at VBG at 2100 UTC on 31 March 2013.  Thicker line indicates highest quality data.

Temperature and dew point soundings from AIRS at VBG at 2100 UTC on 31 March 2013. Thicker line indicates highest quality data.

Improved Ozone Monitoring with the release of AIRS Version 6 data

Author: Emily Berndt

The AIRS project released AIRS version 6 data late last week. Significant improvements in data quality were immediately noticed here at SPoRT after the first image utilizing version 6 data was processed.

The first graphic is a plot of AIRS ozone utilizing version 5 data. You can see the gray regions, which represent gaps in the data and poor quality data due to cloud contamination. The second graphic is a plot of AIRS ozone utilizing version 6 data. There are far less gaps in data and data quality issues.

20130314_1100_sport_natloc_airso3

AIRS Ozone 1100 UTC March 14th 2013 utilizing version 5 data

20130315_1200_sport_natloc_airso3

AIRS Ozone 1200 UTC March 15th 2013 utilizing version 6 data

The last two images show the AIRS ozone and GOES West infrared imagery from 1400 UTC this morning. Focus on the low pressure system just south of the Aleutian Islands and compare the two images. Despite the cloud cover associated with the low pressure system, the AIRS ozone was minimally contaminated by the clouds and a clearer picture of ozone was retrieved.  The AIRS project plans to process the entire mission as version 6 data by the end of 2013. Therefore the data quality issues will be addressed for the entire mission back to 2002.

20130318_1400_sport_natloc_airso3

AIRS Ozone 1400 UTC March 18th 2013 utilizing version 6 data

2013077_1400rb

GOES West Infrared Satellite Imagery 1400 UTC March 18th 2013

Moisture Plume in Layers

Moisture plumes from the tropical Pacific can extend into the mid-latitudes, and the CIRA Layer Precipitable Water (LPW) product based on microwave (AMSU, MHS) and infrared (AIRS) sounding instruments from NASA and NOAA polar-orbiting satelliltes provides information on the amount of moisture in each layer.  Traditional total precipitable water (TPW) data only give part of the picture and Water Vapor (WV) imagery only captures the upper tropospheric moisture.  Note here how the GOES WV imagery from the NASA GHCC site agrees well with the values of 2-4 mm in the 500-300 mb layer between Hawaii and the west CONUS.

20130313_2100_sport_cira_west_lpw500to300hpa

500-300 mb Layer Precipitable Water by CIRA, 13 March 2013, 2100Z

20130313_2130_GHCC_GOESW_WV

GOES Water Vapor imagery from NASA GHCC site, 13 March 2013, 2130Z

In the images below, the surface to 850 mb layer shows a wide plume of 0.5 to 0.75 inches of PW extending from Hawaii to Washington and Oregon. Moving upwards, the 850 to 700 mb layer continues to show a wide swath of moisture (~0.25 to 0.5 inches) in this same area, with a sharp gradient to the east.  Lastly, the 700 to 500 mb layer shows a more narrow moisture swath, but still with values ranging from ~0.25 to 0.33 inches, and extending into the northwest CONUS. The observations of vertical distribution of moisture in data void regions can be compared to NWP models as well as applied to estimating the available moisture at low levels for potential precipitation and flooding events.

20130313_2100_sport_cira_west_lpwsfcto850hpa

Surface to 850 mb Layer Precipitable Water by CIRA, 13 March 2013, 2100Z

20130313_2100_sport_cira_west_lpw850to700hpa

850 to 700 mb Layer Precipitable Water by CIRA, 13 March 2013, 2100Z

20130313_2100_sport_cira_west_lpw700to500hpa

700 to 500 mb Layer Precipitable Water by CIRA, 13 March 2013, 2100Z

Early February Northeast Blizzard

The Northeast is bearing down for a blizzard as two storm systems are expected to merge off the East Coast early Saturday morning. Currently, one low pressure center is near Lake Erie and the other one is off the Virginia coast (see surface map below). Once the two systems phase off the East Coast, the new system is expected to rapidly deepen to 970 mb. Blizzard conditions will result as 1-2 feet of snow falls and winds gust to as high as 70 mph.

HPC 1500 UTC Surface Analysis Feb. 8, 2013

HPC 1500 UTC Surface Analysis Feb. 8, 2013

From a satellite perspective, how can some of the new GOES-R imagery and AIRS profiles help identify significant features associated with this unique synoptic set up? Below is an RGB Air Mass image from 0634 UTC this morning. The image gives a clear view of the coastal storm. Notice the green colors to the south of the main cloud shield, indicated by a blue arrow. The green colors represent warm, moist tropical air that is being drawn into the storm.  This air mass will provide abundant moisture to produce the robust snow fall amounts expected. A VIIRS/CRiS RGB Air Mass image from 0733 UTC this morning gives a broader view of the Eastern United States and shows the structure of both storms. The storm situated over the Great Lakes will usher cold air into the Northeast. There are also green colors to the north and northwest of the Great Lakes storm however they indicate cold, moist air.

RGB1

NASA SPoRT Aqua MODIS RGB Air Mass Image  0634 UTC Feb. 8, 2013.
Yellow arrow points to ozone rich stratospheric air and Blue arrow points to warm, moist tropical air.

NASA SPoRT VIIRS/CRiS RGB Air Mass Image     0733 UTC Feb. 8, 2013.
Yellow arrow points to ozone rich stratospheric air

Stratospheric intrusions are commonly associated with rapidly developing cyclones and may be responsible for transporting higher momentum air to the surface to produce damaging winds at the surface. If we piece together information from the RGB Air Mass imagery, AIRS total column ozone, and a 300 mb map, can we find an explanation to why this system will be associated with strong wind gusts?  The 1200 UTC 300 mb observations, pictured below, show a 125 kt jet streak north of Maine. The red/orange colors in the MODIS RGB Air Mass imagery indicate the presence of a jet streak and high potential vorticity air.  The AIRS total column ozone, pictured below, indicates higher values of ozone in the same vicinity. The presence of high potential vorticity air and larger amounts of ozone signify higher momentum stratospheric air intruding into the troposphere. Some of this stratospheric air is being drawn into the Great Lakes storm, shown by the yellow arrows on the VIIRS/CRiS RGB Air Mass image. Unfortunately  there was not an AIRS pass to the east of the storm system to further confirm ozone-rich stratospheric air. As the system continues to progress, more AIRS data and RGB Air Mass data will be investigated to watch how stratospheric air is drawn into the storm and how it relates to the production of surface wind gusts.

300 mb Heights (dm) and Isotachs (kts) 1200 UTC Feb. 8, 2013. Image from NCAR RAL Real Time Weather Data website

AIRS Total Column Ozone 0630-0636 UTC            Feb. 8, 2013