Normalized Burn Ratio (NBR) Imagery in AWIPS…

Landscapes that have succumbed to wildfires, or burn scars, present especially difficult hydrologic forecasting challenges for National Weather Service (NWS) Offices since they can be conducive to the development of flash flooding and debris flows.  While the relationship between burn severity and this threat is rather complicated and dependent on a number of factors, determining the severity of the burned landscape can be important.  In order to assess this threat, professionals from a range of disciplines comprising Burned Area Emergency Response (BAER) Teams conduct intensive field surveys at the burn site.  BAER Teams conduct surveys as soon as team logistics and conditions allow, including containment levels of the wildfire (50% to 80% in many cases).  However, the threat for the development of debris flows and flash flooding can occur before these assessments can be made and as the wildfire is still actively burning.  Additionally, surveys are not conducted at all burn scars, especially in non federally-owned lands.  Traditionally, satellite imagery of burn scars has been used to help remedy this gap in knowledge about burn severity at any given location.  This imagery utilizes contrasting spectral properties between burned areas and healthy vegetation from a combination of Near-IR (~0.86 µm) and Shortwave IR (~2.25 µm) bands.  Imagery from Landsat and other high-resolution instruments has commonly been sought and used in associated analyses, but passes from high-resolution imagers can be infrequent, and cloud cover cover can obscure a single pass.  Thus, waiting periods for this type of imagery can be days to weeks depending on temporal availability of satellite passes and weather conditions.  To help with this issue, NASA SPoRT has developed the generation of NBR imagery in real-time in the Automated Weather Interactive Processing System (AWIPS) using data from the GOES-16 and GOES-17 satellites (Image 1).  Additionally, imagery from the VIIRS instrument aboard S-NPP has also been developed and transferred to AWIPS on an experimental basis.

Image 1. GOES-16 NBR imagery ((0.86 µm – 2.25 µm) / (0.86 µm + 2.25 µm)) overlaid with part transparent Visible (0.64 µm) imagery, 1751 UTC 8 Nov 2019

The compromise with GOES imagery is the lack of higher-resolution and thus detail observed in other imagery, yet analysis of a few fires so far this past fire season has indicated good agreement between GOES and VIIRS imagery.  A few examples are posted below.  Based on the color scale used, healthy/undisturbed vegetation is indicated by green colors, while burned areas appear in colors ranging from brighter yellows to oranges to reds.  The difference in resolution between the 0.86 and 2.25 µm bands in GOES-17 imagery causes “false” signatures along bodies of water.

Image 2. Woodbury Fire burn scar, GOES-17 NBR 1936 UTC 1 July 2019 (left), S-NPP NBR 1936 UTC 1 July 2019 (right), along with 2019 Fire Perimeters (black outlines)

Image 3. Kincade Fire burn scar, GOES-17 NBR 2101 UTC 7 Nov 2019 (left), S-NPP NBR 2057 UTC 7 Nov 2019 (right), along with 2019 Fire Perimeters (black outlines)

Image 4.  Recent So. California fire burn scars, GOES-17 NBR 2056 UTC 7 Nov 2019 (left), S-NPP NBR 2057 UTC 7 Nov 2019 (right), along with 2019 Fire Perimeters (black outlines)

While BAER Teams and Incident Meteorologists (IMETs) have also expressed a desire to have these types of imagery outside of AWIPS, in GIS-friendly formats, the advantage of making the imagery available in AWIPS is that forecasters can overlay it with other relevant hydrologic data sets that may help forecasters to better estimate the threat for flooding and debris flows.  Another advantage of having data generated from GOES is the high temporal resolution of the data, allowing near-continuous analysis of burn scar development as the fire is ongoing (provided clear sky conditions from clouds or smoke).

Image 5. Sample loop of the Woodbury Fire in AZ, GOES-17 NBR overlaid with partial transparent visible (0.64 µm) imagery, 2101-2251 UTC 17 June 2019.  Notice the burn scar that has already developed in western parts of the burn area (orange/yellow colors), while smoke can be seen emanating from the ongoing fire in NE parts of the fire complex (red colors).

While related development work is continuing, the SPoRT team will be discussing the potential use of this imagery with collaborative NWS offices, especially in the West CONUS,  for the next wildfire season.

-Kris W.

NASA SPoRT’s SST Composite Maps Capture Upwelling in the Wakes of Hurricanes Dorian and Humberto

NASA SPoRT’s SST Composite Maps Capture Upwelling in the Wakes of Hurricanes Dorian and Humberto

Written by Patrick Duran, Frank LaFontaine, and Erika Duran

Category 5 Hurricane Dorian passed over the Bahamas between September 1 and 3 2019, producing catastrophic destruction and causing at least 60 direct fatalities in the island nation. In addition to the impacts on human life, strong, slow-moving hurricanes like Dorian can leave lasting effects on the ocean over which they travel. Through a process known as upwelling, hurricanes bring colder water from below the surface up to the top layer of the ocean.  As a result, a trail of cooler sea surface temperatures (SSTs), also referred to as a “cold wake,” is often visible behind a passing storm. Meteorologists and oceanographers can monitor changes in SST and identify a cold wake following tropical cyclones using satellite data.

NASA SPoRT produces composite maps of SST twice daily using data from the VIIRS-NPP, MODIS-Aqua, and MODIS-Terra instruments, along with OSTIA-UKMO data obtained from the GHRSST archive at NASA’s Jet Propulsion Laboratory and the NESDIS GOES-POES SST product. The input data are weighted by latency and resolution to produce the composite, which is available at 2 km resolution.

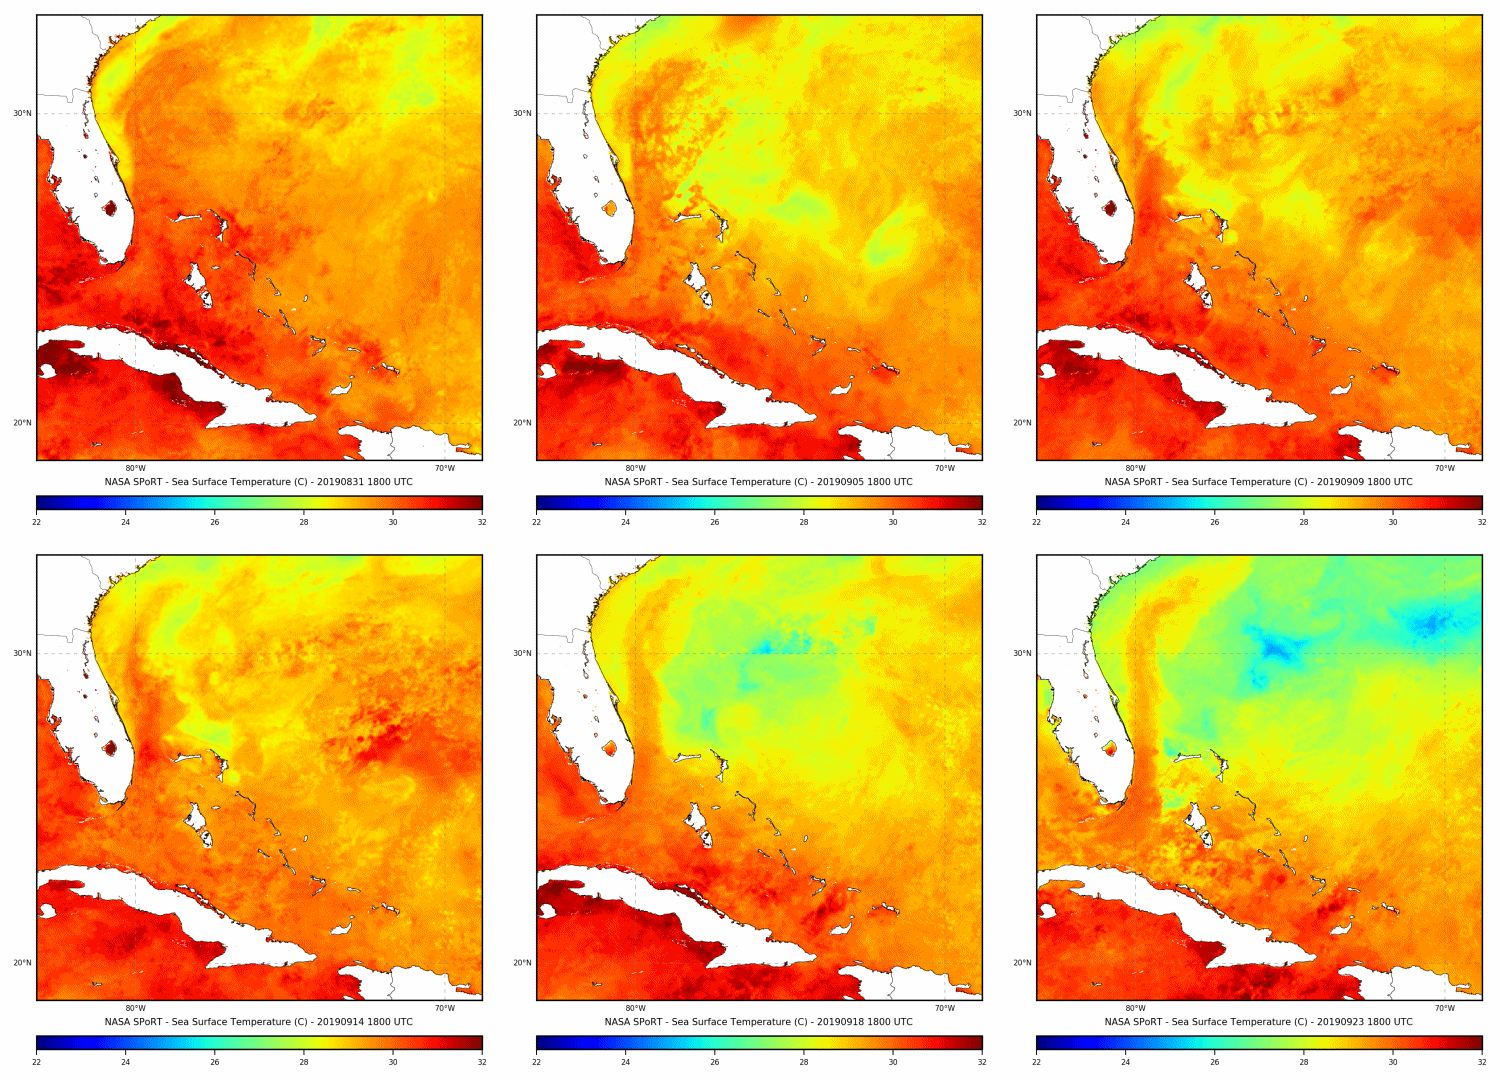
Figure 1 shows a loop of the SPoRT SST composite from August 31 – September 23, 2019 over a region that includes the Bahamas and the Southeast United States. Two rounds of SST cooling are observed as Hurricanes Dorian and Humberto move through the region.

Figure 1: Animation of NASA SPoRT SST Composite Maps from August 21 through September 23, 2019. Daily images are displayed at 1800 UTC.

On August 31, very warm SSTs of around 29-30 deg Celsius (84-86 deg Fahrenheit) overspread the waters surrounding the Bahamas (Fig. 2).

Figure 2: SST Composite Map at 1800 UTC on August 31, 2019.

After Hurricane Dorian tracked through the region and made landfall in North Carolina on September 6, the waters north of the Bahamas were considerably cooler – in the 26–29 deg Celsius (79–84 deg Fahrenheit) range (Fig. 3).

Figure 3: As in Fig. 2, but for September 6, 2019.

Over the next week, the surface waters warmed a degree or two (Fig. 4), but did not fully recover to the same temperature observed on 31 August.

As in Figs. 2-3, but for September 13, 2019.

On September 13, Tropical Storm Humberto formed 210 km (130 miles) ESE of Great Abaco Island. As the storm tracked northeast past the Bahamas, it encountered the cold wake left by Hurricane Dorian the previous week. These cooler waters, combined with the influence of some dry air and vertical wind shear, inhibited the storm’s intensification as it passed by the Bahamas. On September 15, Humberto moved over the warmer waters of the Gulf Stream off the coast of North Florida (Fig. 5) intensified to hurricane strength.

Figure 5: As in Figs 2-4, but for September 15, 2019.

Humberto continued to strengthen, and attained a maximum sustained wind speed of 125 MPH as it passed by Bermuda on September 19. Its strong winds and associated waves overturned the same region of ocean that was previously affected by Hurricane Dorian, decreasing sea surface temperatures to as low as 25 deg Celsius (77 deg Fahrenheit) in some areas (Fig. 6).

Fig. 6: As in Figs. 2-5, but for September 19, 2019.

These images highlight the effect that tropical cyclones can have on SST, and how a hurricane can make it more difficult for any subsequent storms to intensify over the same region. Satellite analyses of SSTs (such as those produced by NASA SPoRT) allow forecasters to monitor SST across the globe, helping them to produce better forecasts of tropical cyclone intensity in all ocean basins.

Soil Moisture Conditions over Southeast Texas Prior to Hurricane Harvey

Soil Moisture Conditions over Southeast Texas Prior to Hurricane Harvey

As much-anticipated Hurricane Harvey approaches the southern and eastern coast of Texas today, it is worth examining the pre-existing soil moisture over the region to understand the capacity of the land surface to absorb the upcoming rainfall.  Granted, the amount of rainfall simulated by numerical guidance is off-the-charts high (e.g., today’s 0600 UTC initialized NAM model [Fig. 1] shows 84-hour maximum accumulated rainfall of over 60″ between Corpus Christie and Houston!!).  Thus, extreme flooding is anticipated, regardless of the amount that can be absorbed by the soils.

Fig1_NAMFLT_prec_precacc_084

Figure 1.  The NCEP/NAM model 84-hour forecast of total accumulated precipitation (inches) over Southeastern Texas, from the simulation initialized at 0600 UTC 25 August 2017 [image courtesy of College of DuPage forecast page].

SPoRT manages a real-time simulation of the NASA Land Information System (hereafter, “SPoRT-LIS“), running over the Continental U.S. at ~3-km grid resolution.  The SPoRT-LIS product is a Noah land surface model climatological and real-time simulation over 4 model soil layers (0-10, 10-40, 40-100, and 100-200 cm).  The climatological simulation spans 1981-2013 and forms the basis for daily-updated total-column soil moisture percentiles (forthcoming in Fig. 3), in order to place current soil moisture values into historical context.  For real-time output, the Noah simulation is regularly updated four times per day as an extension of the long-term climatology simulation.  It includes NOAA/NESDIS daily global VIIRS Green Vegetation Fraction data, and the real-time SPoRT-LIS component also incorporates quantitative precipitation estimates (QPE) from the Multi-Radar Multi-Sensor (MRMS) gauge-corrected radar product.  The climatological SPoRT-LIS is based exclusively on atmospheric analysis input from the NOAA/NASA North American Land Data Assimilation System – version 2.

Relative Soil Moisture output from the SPoRT-LIS over the 0-100 cm layer is shown in Fig. 2 over Southeastern Texas and Louisiana at 1200 UTC this morning.  A marked gradient between very dry soils to the west and moist soils to the east occurs in the vicinity of the greater Houston metropolitan area.  The soils in the region bounded by Corpus Christi, San Antonio, Austin, and Houston (areas forecast to have the greatest rainfall from Hurricane Harvey) are extremely dry prior to Harvey’s landfall.  This dryness will help to some extent in absorbing the initial rainfall from Hurricane Harvey.  But with such excessive rainfall being forecast over a prolonged time period (3-5+ days), it won’t be long before the upper portions of the soil column saturates and widespread areal flooding occurs.  In addition, the high forecast rainfall rates could easily result in flash flooding (despite prevailing soil dryness), especially further inland where terrain plays a more important role in runoff and flash flooding.

The total column relative soil moisture percentile from 24 August shows that historically-speaking, the soil moisture is slightly drier than normal, particularly along the coastal plain between Corpus Christi and Houston (Fig. 3).  In this corridor, the soil moisture is generally between the 10th and 30th percentile compared to the 1981-2013 climatological distribution for 24 August.

Fig2_rsoim0-100_20170825_12z_tx_cityLabels

Figure 2.  SPoRT-LIS relative soil moisture (RSM) distribution in the 0-1 meter layer across Southeastern Texas and Louisiana, valid 1200 UTC 25 August 2017.  RSM values of 0% represent wilting (vegetation cannot extract moisture from soil) and 100% represents saturation (subsequent rainfall becomes runoff).

Fig3_rsm02percent_20170824_12z_tx

Figure 3.  Total column (0-2 m) relative soil moisture percentile valid 24 Aug 2017, as compared to all 24 August soil moisture values from a 33-year climatological simulation of the SPoRT-LIS.

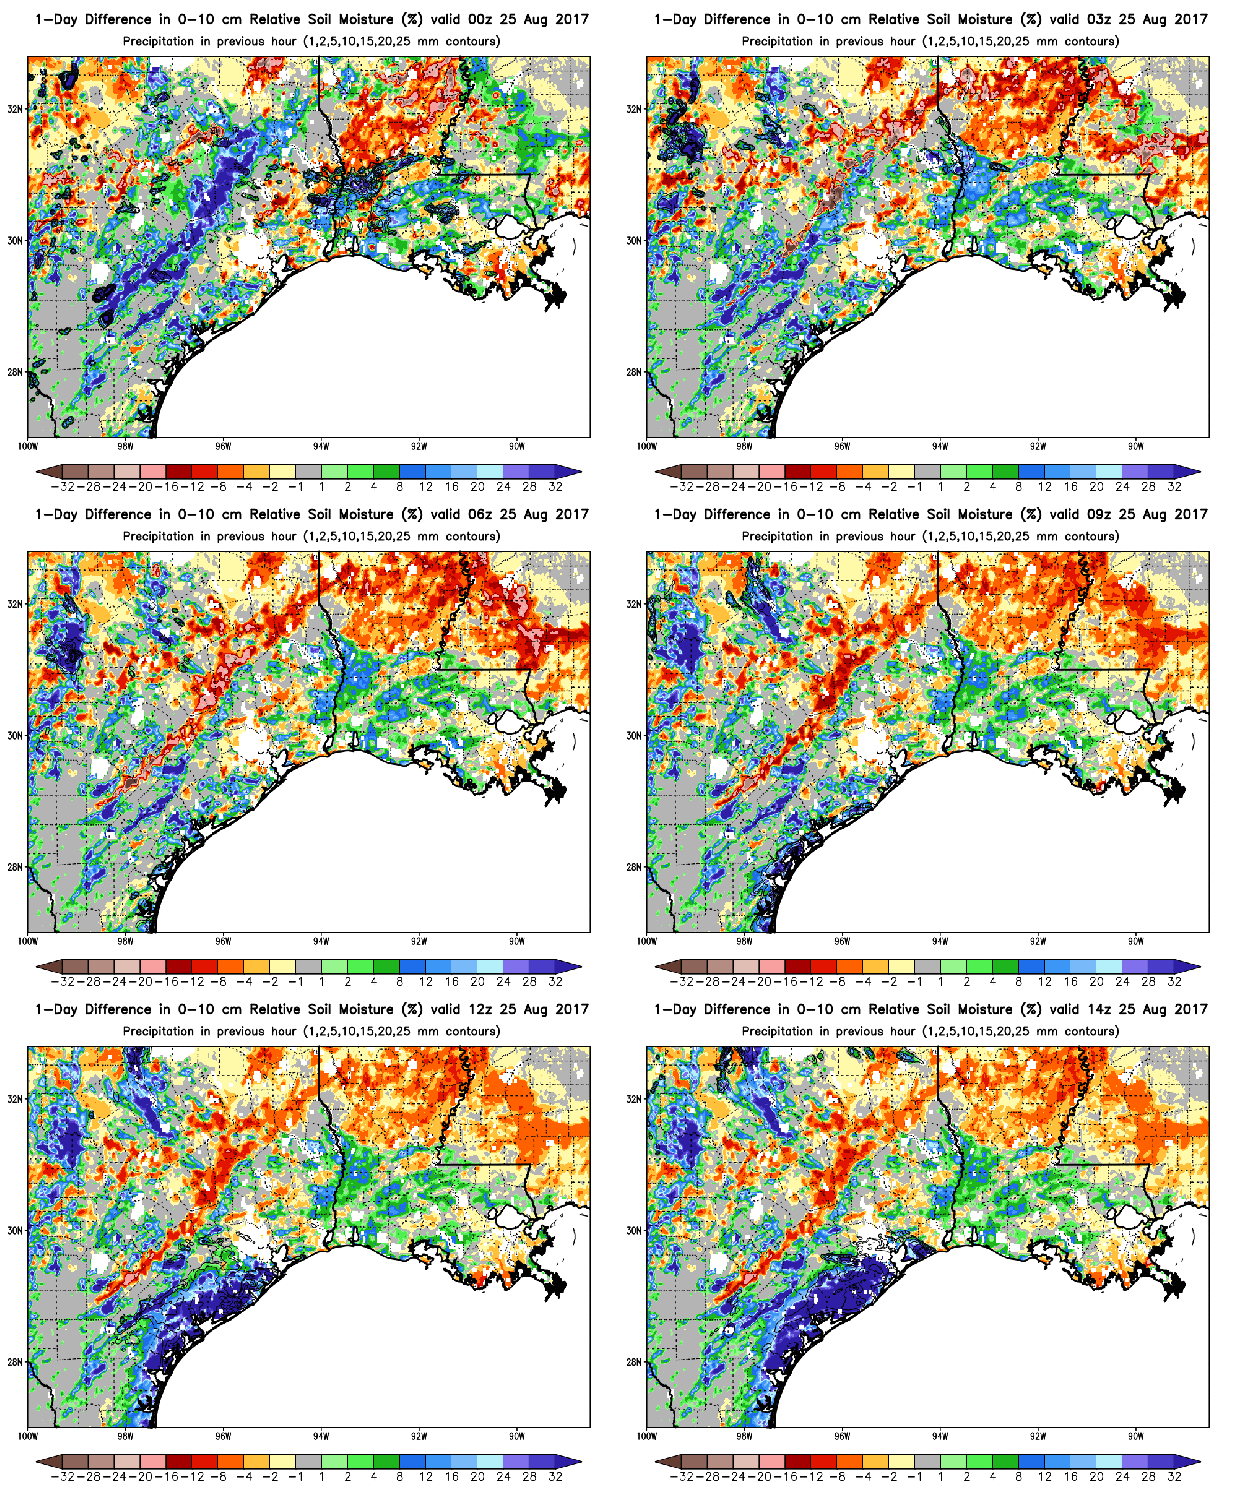
Finally, an hourly animation of the 1-day changes in 0-10 cm (top model layer) relative soil moisture show that the near-surface soils are quickly moistening between Corpus Christi and Houston, as the initial rainbands of Hurricane Harvey began impacting the coastal plain this morning.  As the soils continue to moisten rapidly from the top-down, subsequent rainfall will quickly lead to runoff and flooding.

Fig4_rsoim0-10diff1_20170825_anim

Figure 4.  Hourly animation of 1-day change in top-layer (0-10 cm) relative soil moisture, for the time period spanning 0000-1400 UTC 25 August 2017.  Each hourly image is a simple difference in 0-10 cm relative soil moisture between the current and previous day at the same valid hour.  Line contours depict one-hour QPE from the MRMS product, as input to the real-time SPoRT-LIS.

Nighttime Microphysics for GOES-16

viirsntmicro_obs_20170208

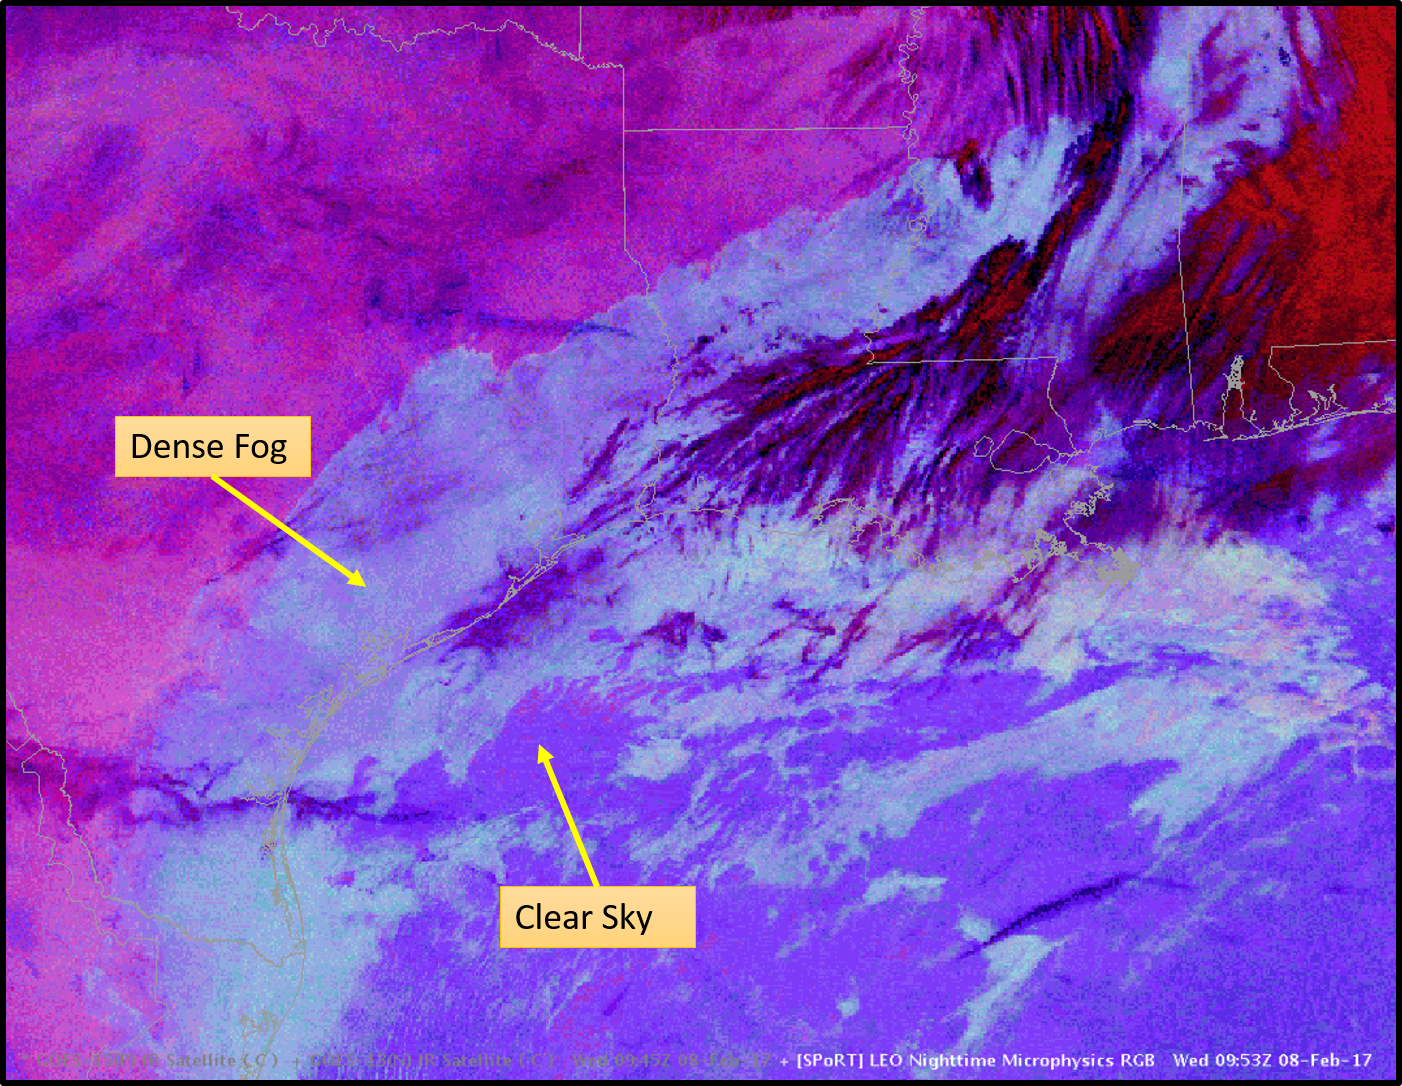
The Nighttime Microphysics RGB Imagery, provided by S-NPP VIIRS in above image, efficiently highlights the low cloud and fog areas in aqua to dull gray, to allow forecasters to better see where hazards exist to transportation (aviation, public, or marine).  This VIIRS image also provides forecasters with a look at the new geostationary capabilities that will be available soon with GOES-16 ABI.  This Nighttime Microphysics RGB Imagery was originally created by EUMETSAT around 2006, transitioned by NASA/SPoRT to forecasters within the NOAA Satellite Proving Ground over the last 5 years, and recently adopted by GOES-16 as one of the many RGB products that will be available to better utilize the ABI three fold increase in the number of bands over the current GOES imager. Currently, the Nighttime Microphysics RGB Imagery from VIIRS as well as several AVHRR and MODIS instruments is regularly used by forecasters in operations, which has allowed them to gain experience in preparation for this new capability from GOES-16.

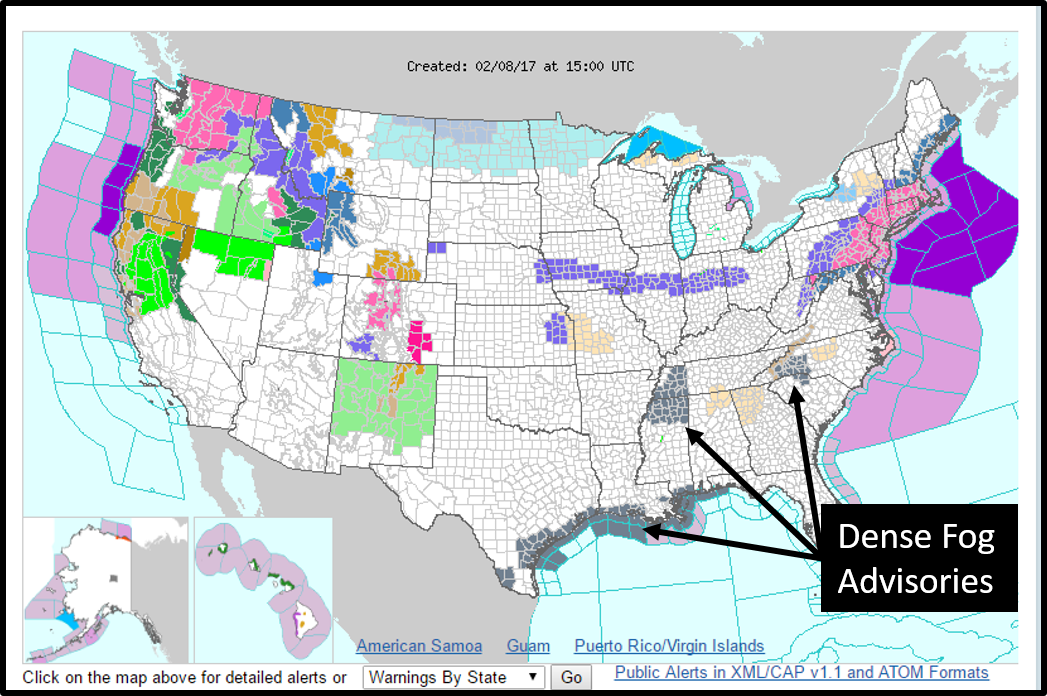
On February 8, 2017 Dense Fog Advisories were in place across the Gulf Coast and parts of the Southeast (see image below) and there have been many similar events in the region for this winter.

nwsdensefogadv

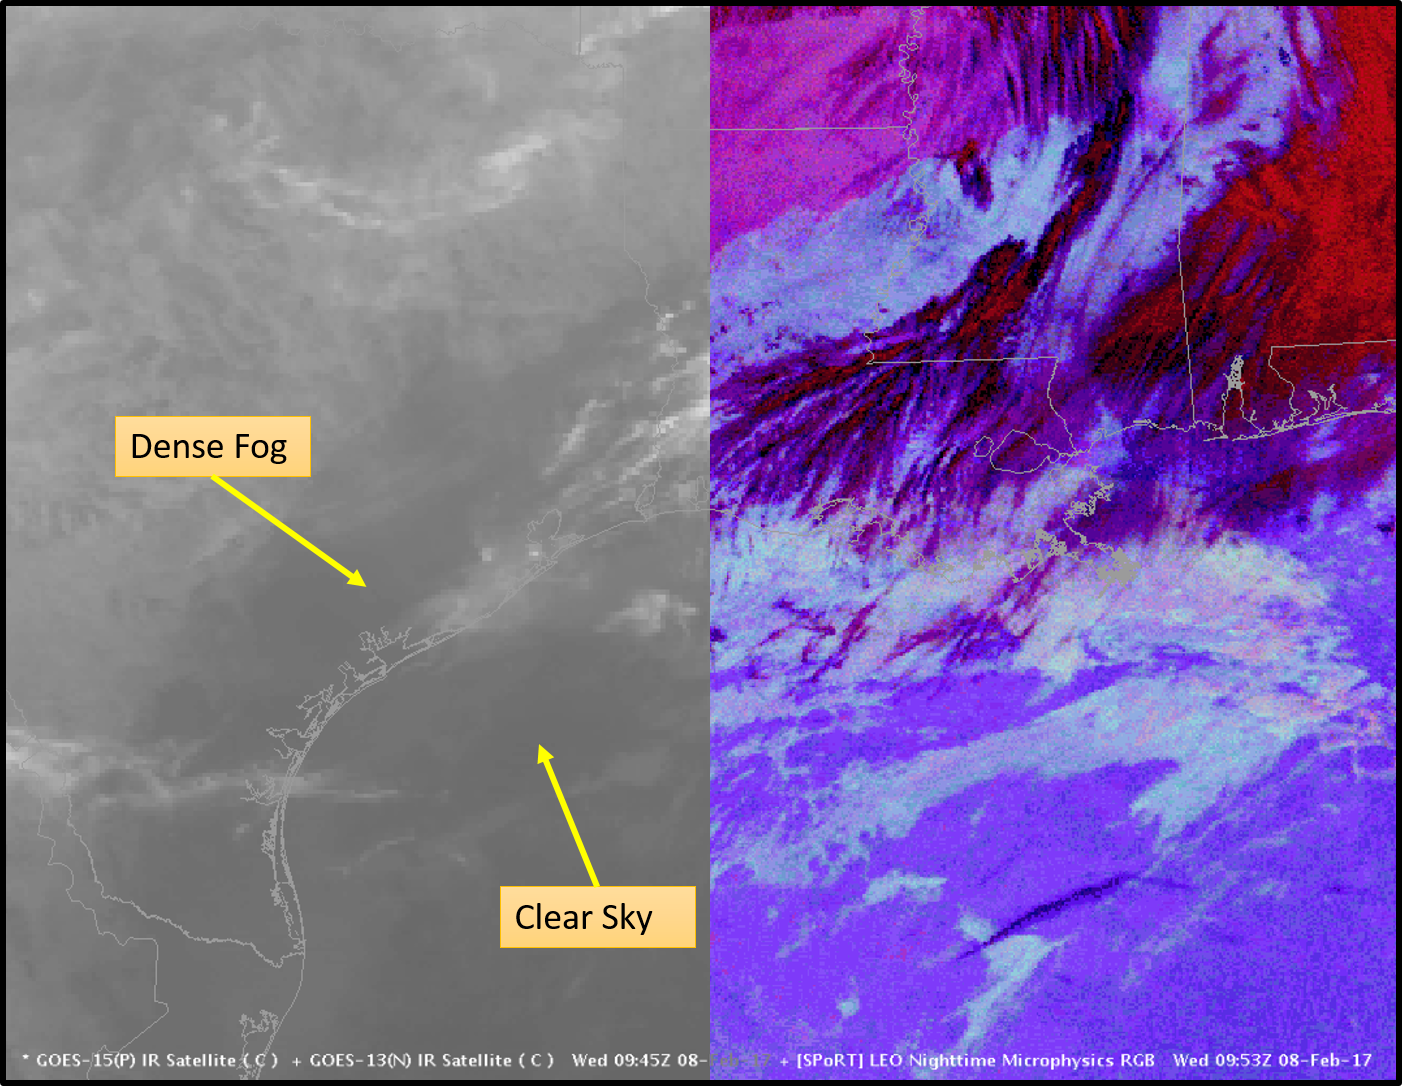
Near 1000 UTC (~4:00am CST) large areas of low ceilings and visibility were occurring in the advisory regions, as seen in the first image of the post.  In the images below, take a look at how the Nighttime Microphysics RGB Imagery (this time from NOAA-19/AVHRR) compares to using a single longwave infrared channel in the split scene of the Gulf Coast region and then compare this with the same scene where only the Nighttime Microphysics  RGB Imagery is shown.  Note that the fog and clear areas can look similar in the infrared image and that the fog itself is a bit warmer than the ground areas in Texas. For help interpreting these types of images, NASA/SPoRT has RGB Quick Guides available at  https://weather.msfc.nasa.gov/sport/training/ .

goesir_avhrrntmicro_gulf_20170208

avhrrntmicro_gulf_20170208

VIIRS Day-Night Band Imagery and Fog Detection

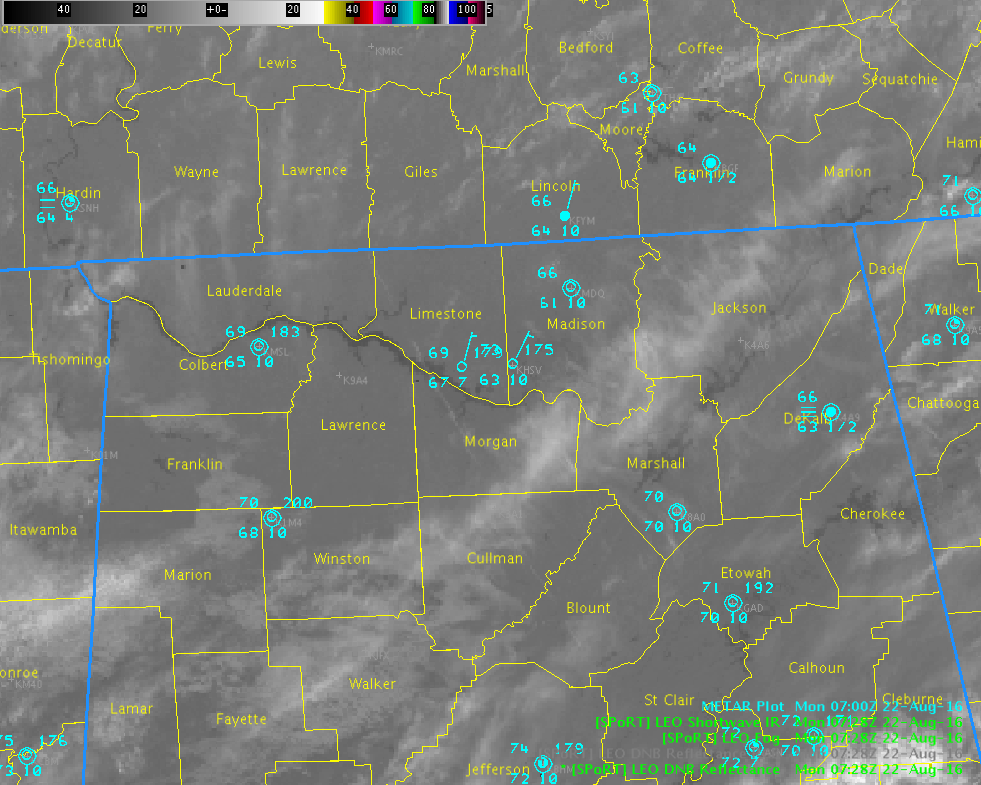
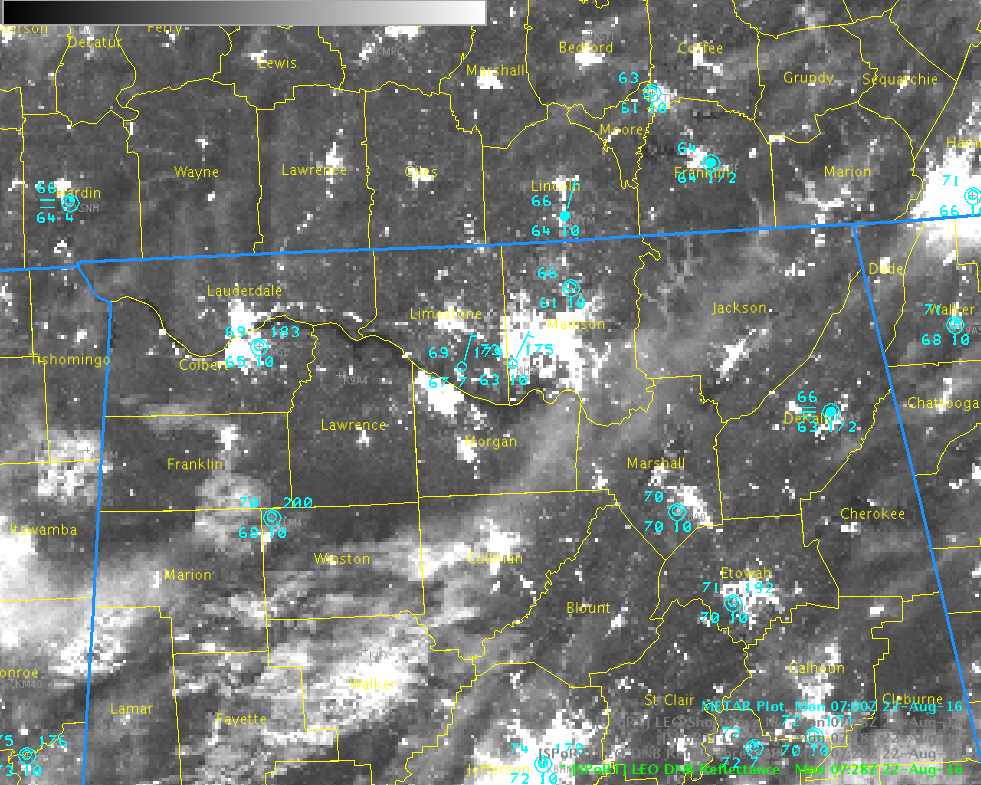
Working midnight shifts this past weekend, I had the opportunity to take a look at the VIIRS Day-Night Band Imagery for the detection and analysis of fog.  Early Monday morning, the observation at Ft. Payne was indicating fog with 1/2 statute mile visibility.  However, the presence of thin cirrus over parts of the area did not allow for the observation of ground phenomena, including fog, in the region via traditional Shortwave IR imagery (Image 1).  However, low clouds and fog were observed in the VIIRS Day-Night Band imagery since the cirrus were sufficiently translucent in the visible portion of the spectrum (Image 2).

ShortWaveIR_22Aug2016_0728Z

Image 1. VIIRS 3.9 µm IR image provided by NASA SPoRT, valid 0728 UTC 22 Aug 2016. Fog cannot be observed in the 3.9 um imagery since the cirrus are sufficiently opaque at this wavelength.

DNBReflectance_22Aug2016_0728Z

Image 2. VIIRS Day-Night Band Reflectance provided by NASA SPoRT, valid 0728 UTC 22 August 2016. Fog can be seen in the narrow Paint Rock Valley of western Jackson County (in northeastern Alabama). Despite the observation of fog at Ft. Payne (DeKalb County AL, –located to the SE of Jackson County), fog cannot be readily observed in the imagery, suggesting that the fog was very localized and perhaps shallow.

I could show the standard fog product imagery (11-3.9 µm), but the story is essentially the same as that of the 3.9 µm imagery of course.  The ability to see through thin cirrus is one of the primary advantages offered by the VIIRS Day-Night Band imagery and thus is among its most useful applications, operationally speaking.  These imagery are a part of the JPSS Proving Ground and have been available in AWIPS here at the HUN office for several years now, including other SPoRT collaborative partners.

In this particular case, it was operationally advantageous to see that the extent of the fog was not widespread and was just confined to some of the more fog-prone valley locations, especially the Paint Rock Valley, and may have only been highly localized to Ft. Payne, or even just the Ft Payne airport observation location.  Had the fog been observed through a larger area in Jackson and especially in DeKalb Counties, then a dense fog advisory might have been necessary.


Snow Cover Blankets Northeastern New Mexico

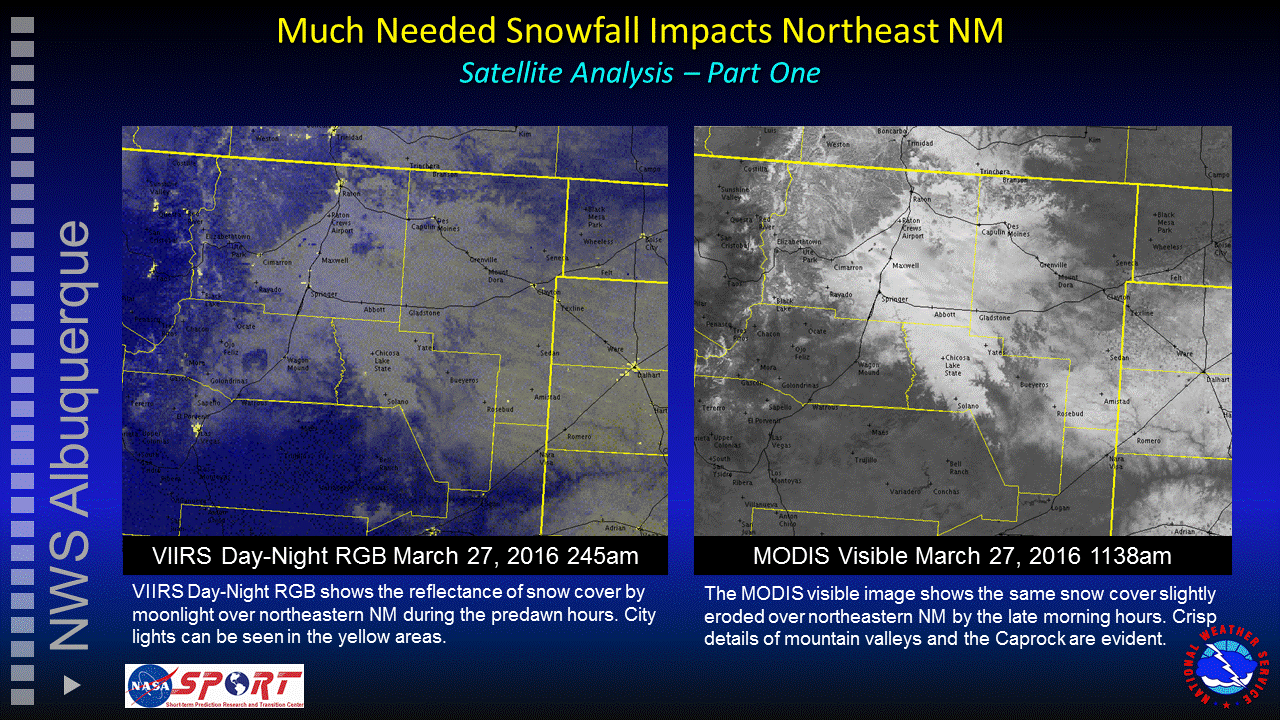
A potent winter storm system impacted portions of New Mexico on March 26, 2016, ending an extended stretch of very dry weather. Snowfall amounts of 3 to 9 inches were reported from the Sangre de Cristo Mountains eastward across the northeast plains. The MODIS and VIIRS satellite products proved useful for illustrating the extent of snow cover in both the daytime and nighttime scenes. The images below are graphical briefings posted to the NWS Albuquerque web page and shared via Twitter after this much needed snowfall event.

Graphical briefing showing the extent of snow cover during the nighttime and daytime periods on March 27, 2016.

Graphical briefing (part one) showing the extent of snow cover during the nighttime and daytime periods on March 27, 2016.

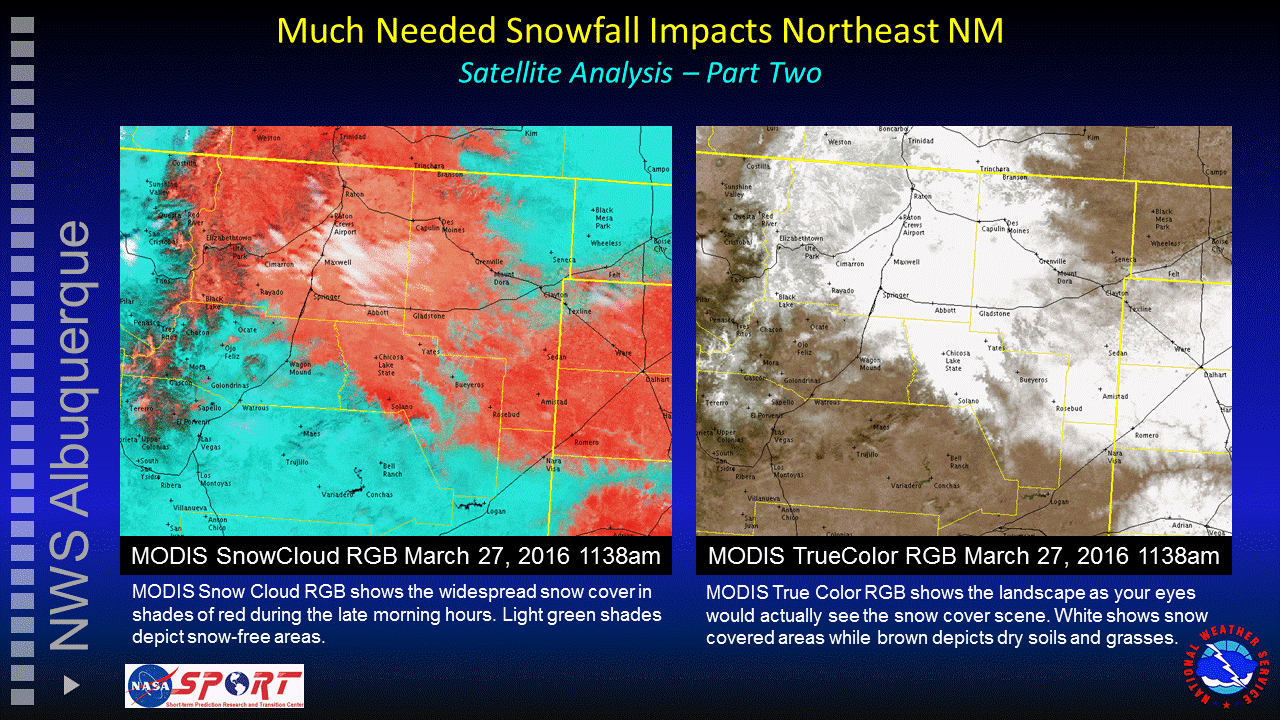
Graphical briefing showing the extent of snow cover through RGBs on March 27, 2016.

Graphical briefing (part two) showing the extent of snow cover through RGBs on March 27, 2016.

LEO Perspective of River-Effect Snow in North Alabama

The cold air outbreak over the eastern United States had impacts far and wide, including the development of snow showers all the way into northern Alabama.  However, between unseasonably low 850 mb temperatures and northwesterly flow, the outbreak also caused a semi-persistent band of snow to develop along the Tennessee River (downwind of a reservoir known as “Lake Wheeler”).

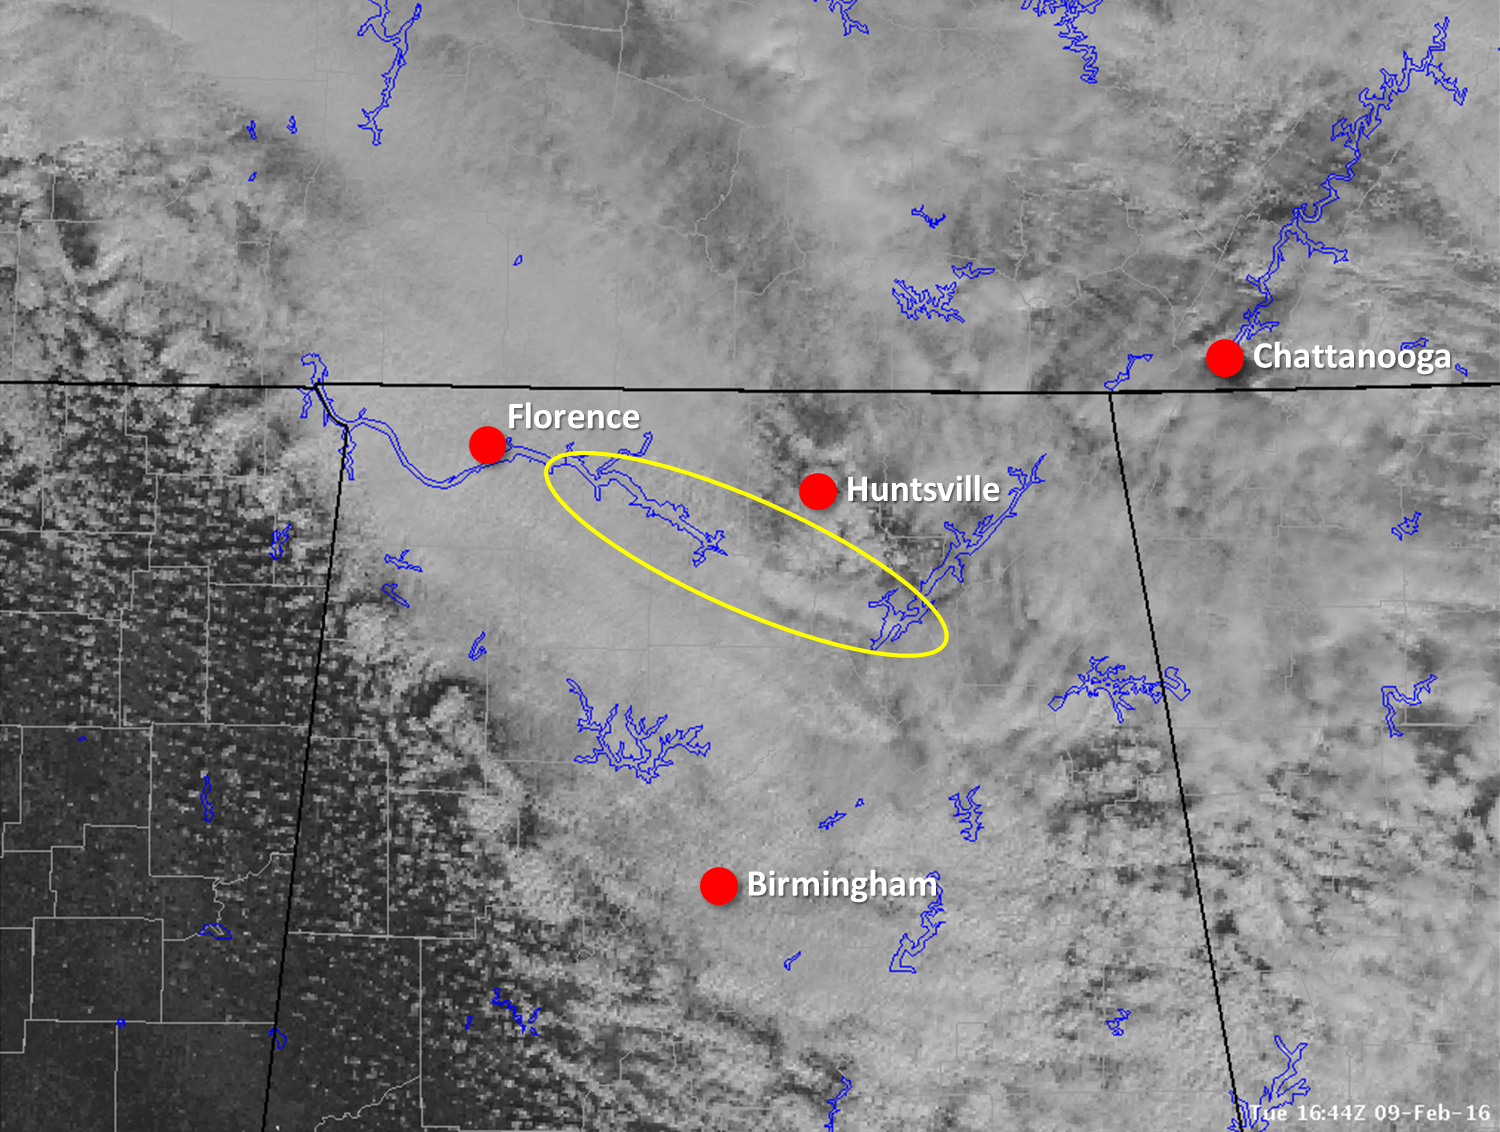
While most of the river-effect monitoring occurred with radar, the late-morning MODIS overpass captured one of the narrow river-effect bands (and did so more effectively than the lower-resolution GOES-East Imagery).

2016-02-09-1644_LESBand-LEO-wLakes-Aug

Figure 1. MODIS visible image, valid 1644 UTC 9 February 2016.  Larger lakes are outlined in blue, and the river-effect band is circled in yellow.

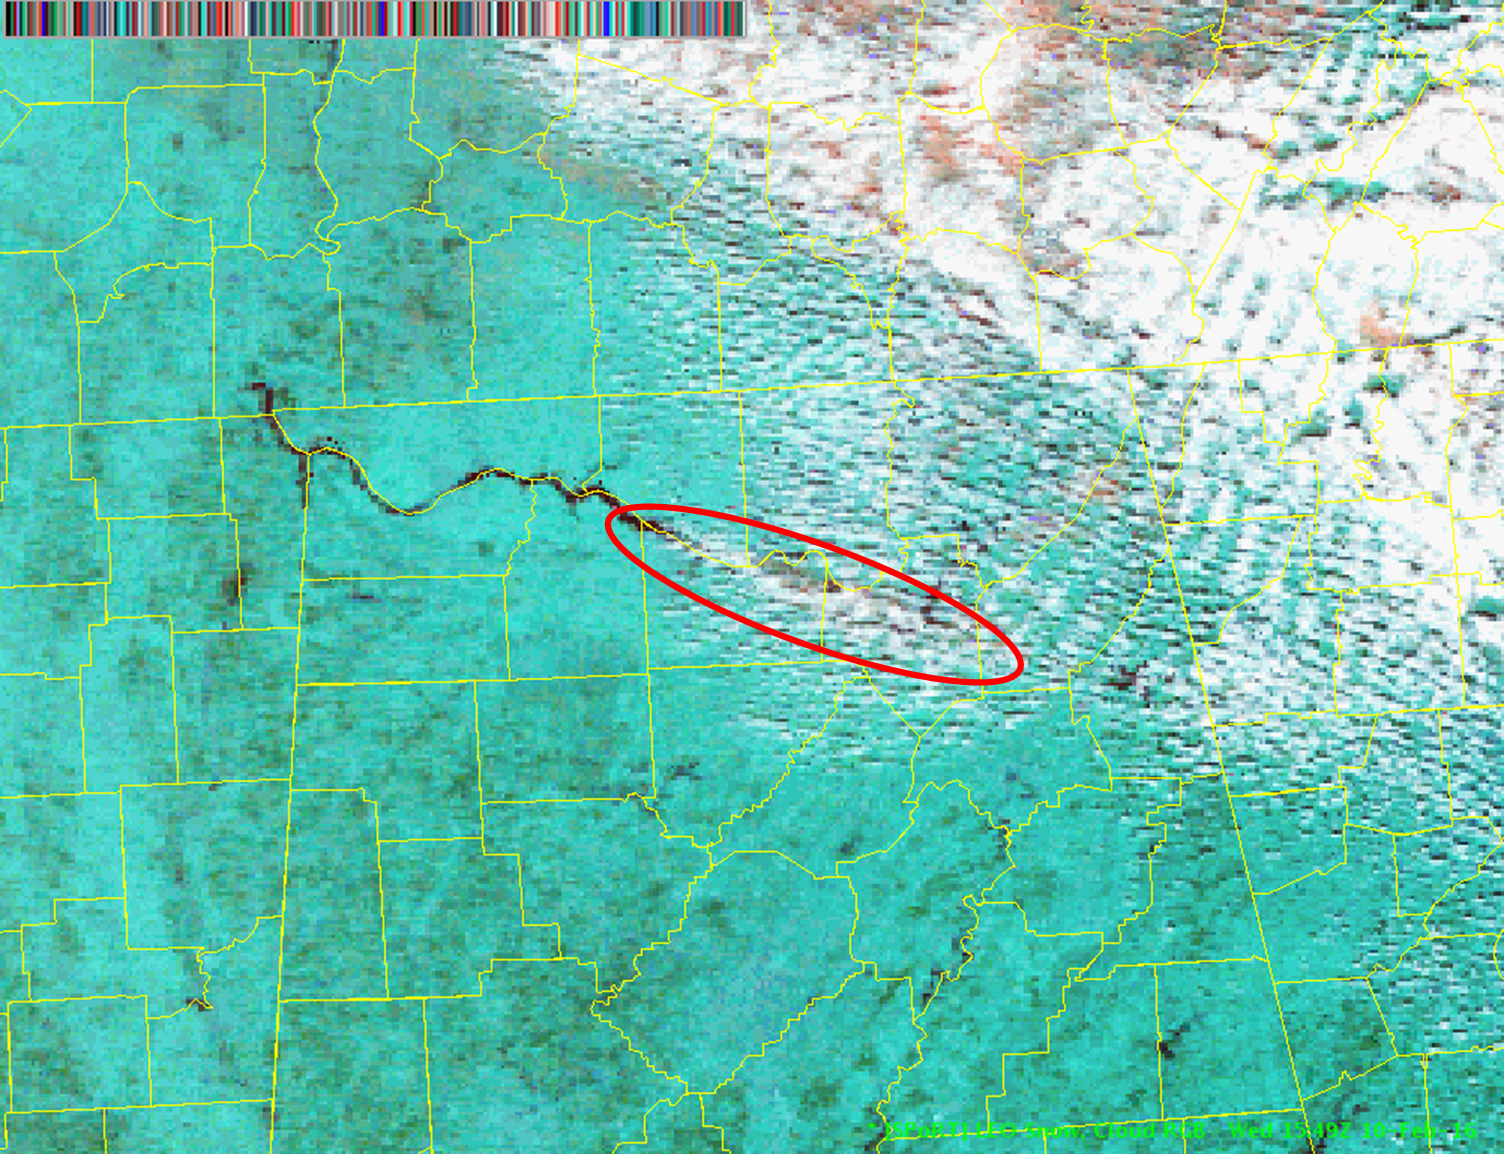
Snowfall reports from underneath the band have indicated 2 to 3 inches of snow, compared to the 1-2 inches reported with heavy or persistent snow showers elsewhere.  Unfortunately, orbit timing and cloud cover have not allowed us to view the snow swath using the Snow-Cloud RGB.  However, the Snow-Cloud RGB from the edge of this morning’s MODIS pass still illustrated the river-effect band persistence.

SnowCloud_10Feb2016_Aug

Figure 2. MODIS Snow-Cloud RGB image, valid 1549 UTC 10 February 2016.  The Tennessee River is the dark blue feature in the center of the image; the river effect band is circled in red.

Channel Differencing and RGB Issues Over Desert Locations…

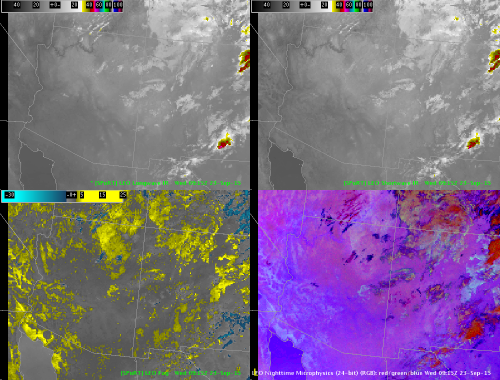
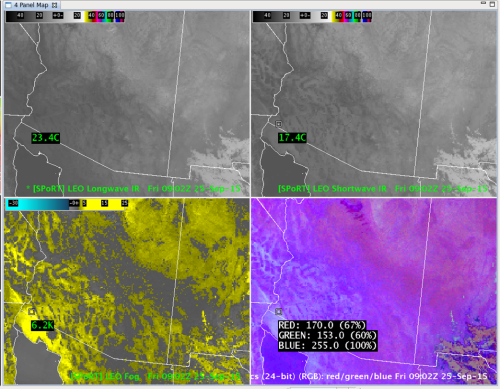
Recently, I had the opportunity to travel to the Tucson NWS office and work with forecasters there concerning a number of experimental data sets transitioned by the SPoRT group.  Primarily, this involved the SPoRT LIS, GPM Constellation and IMERG, and NESDIS QPE data sets.  However, I also had the opportunity to see how other products were being utilized by forecasters.  While taking a look at the Nighttime Microphysics RGB image, I was initially perplexed by the apparent presence of fog and low clouds in parts of the desert southwest.  The first image below is a 4-panel image from AWIPS, showing the Longwave (LW) and Shortwave (SW) IR, the LW-SW IR channel difference, and the Nighttime Microphysics RGB from the VIIRS instrument on the morning of Sept 23rd.

Image 1. Suomi-NPP VIIRS imagery valid 0915 UTC 23 Sep 2015, Longwave IR (upper left), Shortwave IR (upper right), LW-SW IR channel difference (

Image 1. Suomi-NPP VIIRS imagery valid 0915 UTC 23 Sep 2015, Longwave IR (upper left), Shortwave IR (upper right), LW-SW IR channel difference (“fog product”, lower left), and the Nighttime Microphysics RGB (lower right).

The difference in brightness temperatures between the LW and SW IR channels in parts of SW Arizona, SE California and areas of NW Mexico around the Gulf of California, results in relatively large positive values.  Notice the yellow colors that appear in these areas in the channel difference imagery (image 1, lower right), and the corresponding appearance of white-aqua colors in the Nighttime Microphysics RGB (the 10.8-3.9 channel difference represents the green color component of the RGB recipe).  For a forecaster accustomed to looking at these imagery in other parts of the country (and those will less sandy surfaces), these channel difference values and colors in the RGB would suggest the presence of low stratus and/or fog.  However, no clouds or fog were present in those locations during the morning.  You can, however, see some low clouds in portions of central and eastern New Mexico, as indicated by the brighter white-aqua colors.

So, what is going on here?  Well, as eluded to above, it’s the presence of dry sand.  The image below (courtesy of COMET) shows the IR emissivity over several different surface features: tree leaves, red clay, dry sand, and water.

Image 2. IR emissivity vs. wavelength of several surface features, including tree leaves, red clay, dry sand, and water.

Image 2. IR emissivity vs. wavelength of several surface features, including tree leaves, red clay, dry sand, and water.  (image courtesy of COMET)

Notice that the emissivity over dry sand changes fairly substantially through portions of the SW and LW portion of the spectrum, and is lower at 3.9 µm than at 10.8 µm.  The channel difference between 10.8 and 3.9 µm will result in positive values (given clear sky conditions of course) over dry sandy areas, thus mimicking the presence of low clouds and/or fog, as would be the interpretation in other areas.  The next image below demonstrates the LW and SW IR brightness temperatures and differences, along with the Nighttime Microphysics RGB, as sampled over a clear, dry sandy area.

Image 3. Suomi-NPP VIIRS image from 0902 UTC 25 Sep 2015

Image 3. Suomi-NPP VIIRS image from 0902 UTC 25 Sep 2015, LW IR (upper left), SW IR (upper right), LW-SW IR channel difference (lower left), and the Nighttime Microphysics RGB (lower right).

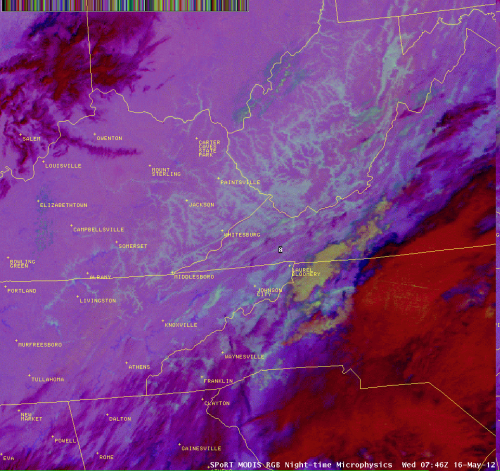
Notice the substantial resulting green color contribution in the Nighttime Microphysics RGB (lower right in above image).  These colors are very similar to colors that would be indicative of fog and other low cloud features as they traditionally appear under similar temperature conditions in other areas outside of dry, sandy areas (image 4 below).

Image 4. Nighttime Microphysics image depicting fog and low clouds (white-aqua colors) in portions of the southern and central Appalachian region.

Image 4. Nighttime Microphysics image depicting fog and low clouds (white-aqua colors) in portions of the southern and central Appalachian region.

Soil Moisture Analysis of Fort Craig Wildfire

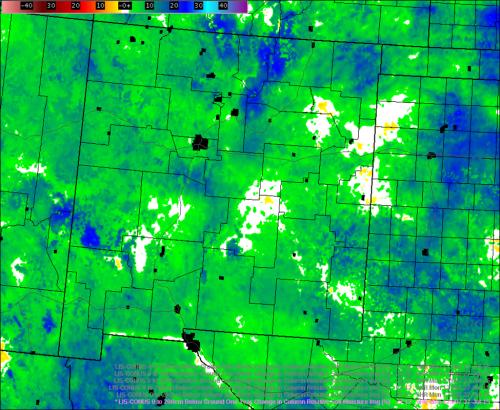
NWS Albuquerque recently began ingesting the updated SPoRT CONUS LIS products in our new AWIPS II system as part of our continued collaboration with SPoRT. These products have already peaked the interest of several local, state, and federal partners. Short-term drought conditions have improved steadily since late winter as more frequent and widespread precipitation events impacted the state. Overall, deep-layer soil moisture conditions have improved substantially compared to this time last year (Fig. 1).

Figure 1. Deep soil moisture (0-200cm) 1-year change valid 12Z 27 July 2015.

Figure 1. Deep soil moisture (0-200cm) 1-year change valid 12Z 27 July 2015.

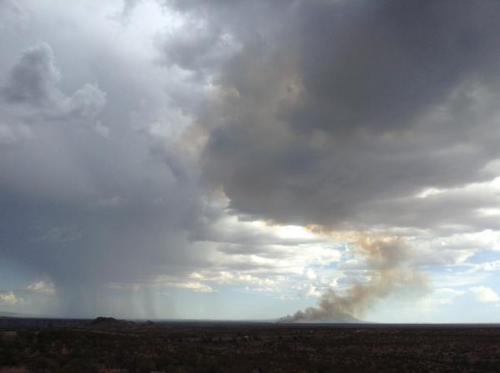
The SPoRT LIS products have become a valuable tool for drought monitoring during our monthly drought workshops. Several state and federal partners noted on our most recent call in late July that these new products provided an additional layer of situational awareness and infuse more science into the drought monitoring process. These products have also peaked the interest of our fire weather community, in particular Incident Meteorologist Brent Wachter. New Mexico during late July is generally under the influence of higher humidity with periodic wetting rainfall events. The convective nature of the precipitation however tends to bring about a patchwork of “have’s and have-nots”. The Fort Craig wildfire broke out in a dry pocket of south central Socorro County within the middle Rio Grande Valley during the afternoon of 26 July 2015. The New Mexico State Climatologist, Dave DuBois, captured the wildfire on camera and posted the image to Twitter shortly thereafter (Fig. 2).

Figure 2. A distant view of the Fort Craig wildfire captured by the New Mexico State Climatologist, Dave DuBois, around 830am, July 27, 2015.

Figure 2. A distant view of the Fort Craig wildfire captured by the New Mexico State Climatologist, Dave DuBois, around 830am, July 27, 2015.

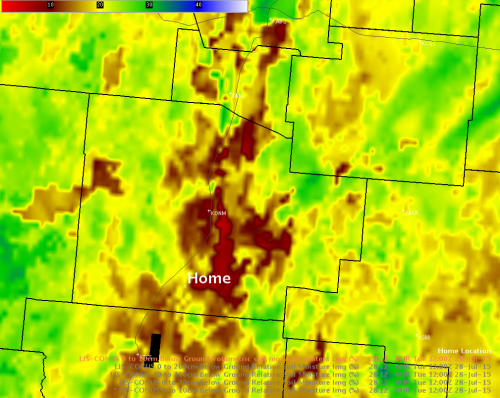
The SPoRT LIS 0-10cm volumetric soil moisture at 12Z 28 July 2015 showed the corresponding dry area where the wildfire developed (Fig. 3). Les Owen from the New Mexico Department of Agriculture also noted this area of drying within Socorro County in what he called his “windshield survey” in mid to late July. The Fort Craig fire grew to nearly 700 acres over the course of two days. The NASA SPoRT soil moisture imagery showed the dry area quite well and the fire was located smack dab in the middle of it.

FIgure 3. NASA SPoRT 0-10cm relative soil moisture within south central Socorro County valid 12Z 28 July 2015. The location of the Fort Craig wildfire is indicated by the home identifier.

FIgure 3. NASA SPoRT 0-10cm volumetric soil moisture within Socorro County valid 12Z 28 July 2015. Note the large dry area in near surface soil moisture in response to the recent dry stretch. The location of the Fort Craig wildfire is indicated by the home identifier.

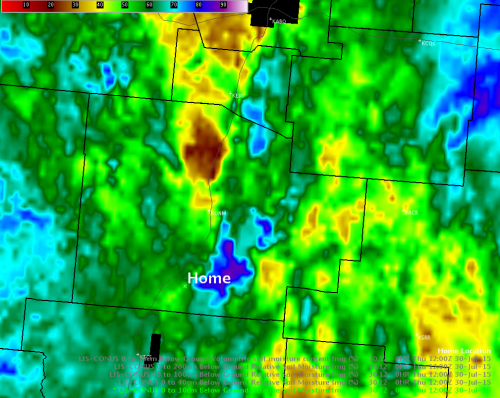
Several storms then impacted the area late on the 28th and the 29th leading to some natural fire suppression and reduction in active fire behavior. The follow-up SPoRT imagery at 12Z 30 July 2015 showed the increase in 0-10cm relative soil moisture over the same area (Fig. 4). The high resolution imagery could be useful in determining fuel dryness for potential fire starts from human activities, cloud to ground lightning ignitions, as well as highlight potential active fire behavior areas. We will continue to assess the possible applications of the SPoRT LIS products as we move through the remainder of the 2015 monsoon season.

Figure 4. NASA SPoRT 0-10cm relative soil moisture within Socorro County valid 12Z 30 July 2015. Note the dramatic increase in near surface soil moisture values in response to the active storm pattern. The location of the wildfire is noted by the home identifier.

Figure 4. NASA SPoRT 0-10cm relative soil moisture within Socorro County valid 12Z 30 July 2015. Note the dramatic increase in near surface soil moisture values in response to the active storm pattern. The location of the Fort Craig wildfire is indicated by the home identifier.

An Evaluation of the SFR Product during a mid-December Winter Storm for Northern New Mexico

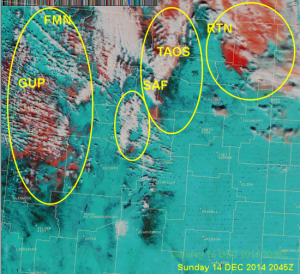
The Albuquerque NWS recently began receiving an updated NESDIS snowfall rate (SFR) product from NASA SPoRT. We were anxious to see how the updated product performed during our most recent winter storm. A fast moving upper level trough and associated Pacific Front blasted into western New Mexico on the afternoon of Saturday, December 13. The upper low deepened and closed off over New Mexico with wrap around snow impacting northeast New Mexico through mid-day Sunday, December 14.  Ahead of the system, temperatures were very warm with Albuquerque reporting a high of 61 and Santa Fe reporting a high of 57 on Saturday.  The RGB snow-cloud product from 2045Z on Sunday depicts snow cover following the event. Four areas in the state were impacted – the western high terrain, the San Juan and Sangre de Cristo Mountains (mainly west slopes) in north central New Mexico, and extreme northeastern corner of New Mexico. Four yellow ovals mark areas to be discussed in this blog entry. Strong westerly, downslope flow on the backside of this storm system resulted in the snow-free region along the eastern slopes between Taos and Raton.
SnowCloud121414_2045Z

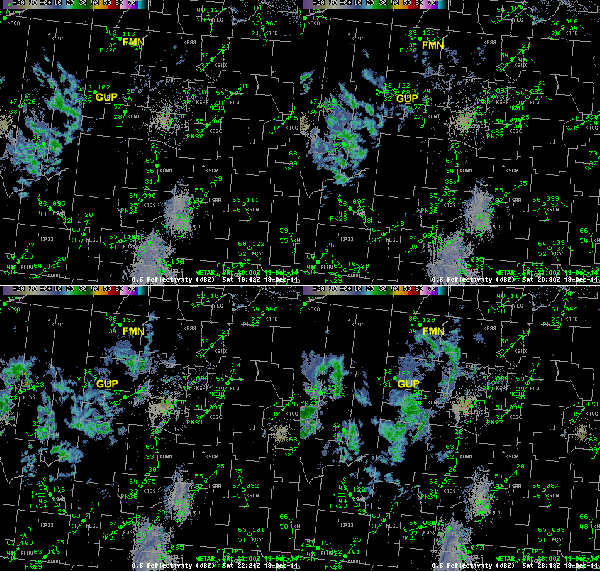
In the loop below, the 0.5 reflectivity mosaic and surface observations show the surface front moving into western New Mexico (left most oval in the snow-cloud product) during the period from 1942Z to 2318Z. In the first image, the winds have shifted to the northwest in Farmington (FMN) and rain is reported as temperatures are too warm to support snow. Note that throughout the loop the Farmington area, especially west and north of the site, there are no radar returns. The Four Corners area has poor to no radar coverage and it is an area where we hope the SFR product will help us. Snow was reported at Gallup (GUP) by 2030Z.

0.5 Reflectivity 1942Z to 2318Z

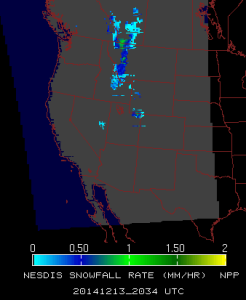
The SFR product was limited during this initial period, with only one swath covering New Mexico at 2034Z (shown below). This image (obtained from the SPoRT product page) shows that snow is detected in northeast Utah and northwest Colorado, but not in northwest New Mexico.  The Gallup area ended up with about one inch of snow while higher terrain south of Gallup reported two to three inches. While only rain was reported at the Farmington ASOS, the snow-cloud product shows some snow just to the east of Farmington where reports of one-half to an inch of snow was reported.

SPoRT_SFR_121314_2034Z

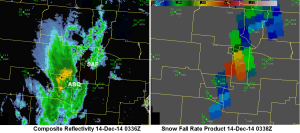
The next SFR product with coverage over New Mexico had a timestamp of 0338Z (14 December 2014), and is compared to the composite reflectivity image of 0336Z in the image below. Reflectivity is strongest just west and northwest of the Albuquerque ASOS (ABQ), which is reporting rain. The cold front however was moving quickly from west to east toward the ABQ metro area. The strong reflectivity returns to the northwest of Albuqurque are actually bright banding as rain began changing over to snow. The dual polarization hydrometeor classification algorithm showed the rain/snow line shifting quickly eastward. Fifteen minutes prior to this image, rain transition to snow was reported in Rio Rancho, just northwest of Albuquerque. The higher terrain just east of Albuquerque, the Sandia and Manzano Mountains, did receive snow accumulations of two to four inches and the SFR product highlights that area with light rates (blue) of about .02 inches/hour. The Santa Fe area (SAF) is not reporting snow at this time, but is highlighted with the max values of SFR, though snow reports in the Santa Fe area were generally less than 2 inches.  Recall that afternoon temperature were quite warm, making it difficult for snow to accumulate. The SFR product also depicts rates up to .05 inches/hour over the Sangre de Cristo mountains north and east of Santa Fe, where accumulations of 4 to 8 inches were reported. Interestingly, the SFR product is estimating precipitation around Santa Fe when the radar reflectivity pattern and observation do not indicate rain or snow. A portion of this area to the immediate northeast and east of ABQ is beam-blocked by the Sandia Mountains (yellow oval southwest of SAF).

mosaic_Comp_Ref_20141214_0336_SFR_0338Z

A similar comparison is shown for 13 hours later, or around 1655Z on December 15. (Another image was available around 08Z, but is not discussed in the post.)  Note that the SFR product depicts accumulating snow, albeit light, from eastern Taos through all but extreme southern Colfax County. Two stations (KAXX and KRTN) are reporting snow, but radar composite reflectivities do not extend over either location. Snow did accumulate at KAXX, but not at Raton (KRTN) where temperatures hovered right above freezing.

mosaic_Comp_Ref_20141214_1642_SFR_1645Z

Snow that is evident in extreme northeast New Mexico occurred after mainly 16Z and was associated with persistent wrap around precipitation (a SFR product was not available). The SFR product was not used in near real time for this event but was re-examined only a short time thereafter. However, the product did validate that we will indeed be able to complement radar void coverage areas in an operational forecast environment using polar-orbiting satellite imagery. This example will also serve to highlight potential product applications, advantages, and disadvantages for forecaster training prior to the upcoming NESDIS evaluation period.